Test, debug and troubleshoot the web trackers
To prevent data loss and bad events, it's important to test and validate your tracking implementation. Snowplow provides two main tools for this, which work well together.
Snowplow Inspector for browsers
Use our browser extension to inspect event requests in the browser Developer Tools window.
Snowplow Micro
A lightweight Snowplow pipeline ideal for sending test events into. You can deploy it through Console or run it locally via Docker.
Debugger plugin
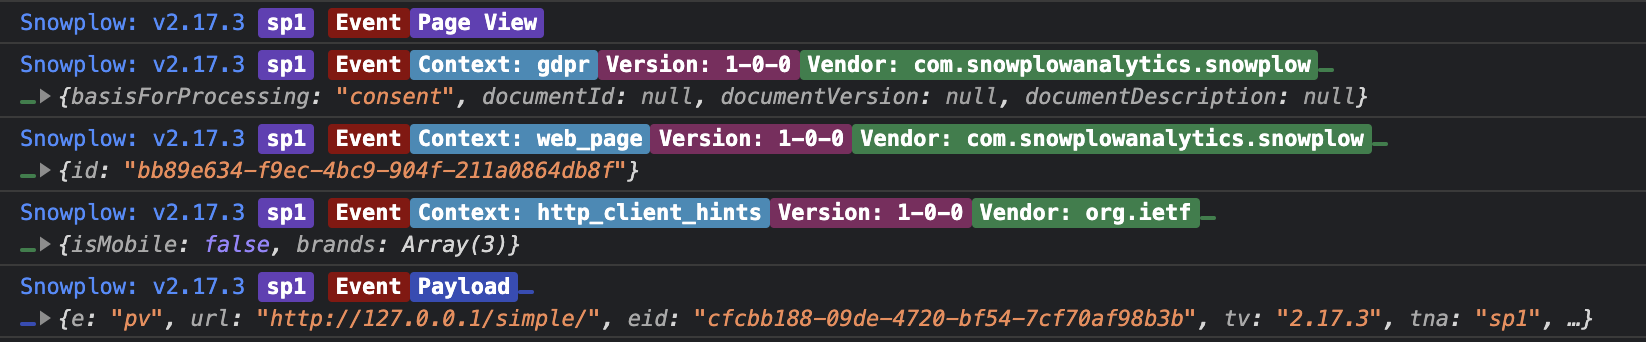
The debugger plugin logs detailed information about tracked events to your browser's Developer Tools console. For each event, it displays:
- Event type
- Schema information for self-describing events and entities
- All entities attached to the event
- The complete event payload sent to the Collector
The plugin uses color-coded output to distinguish between different types of information, making it easier to scan through logged events.
You may need to enable Verbose logs in your Developer Tools console, as this plugin uses console.debug to output results.
Install plugin
- JavaScript (tag)
- Browser (npm)
| Tracker Distribution | Included |
|---|---|
sp.js | ❌ |
sp.lite.js | ❌ |
Download:
| Download from GitHub Releases (Recommended) | Github Releases (plugins.umd.zip) |
| Available on jsDelivr | jsDelivr (latest) |
| Available on unpkg | unpkg (latest) |
Note: The links to the CDNs above point to the current latest version. You should pin to a specific version when integrating this plugin on your website if you are using a third party CDN in production.
window.snowplow('addPlugin',
  "https://cdn.jsdelivr.net/npm/@snowplow/browser-plugin-debugger@latest/dist/index.umd.min.js",
  ["snowplowDebugger", "DebuggerPlugin"]
);
npm install @snowplow/browser-plugin-debuggeryarn add @snowplow/browser-plugin-debuggerpnpm add @snowplow/browser-plugin-debugger
import { newTracker } from '@snowplow/browser-tracker';
import { DebuggerPlugin } from '@snowplow/browser-plugin-debugger';

newTracker('sp1', '{{collector_url}}', {
   appId: 'my-app-id',
   plugins: [ DebuggerPlugin() ],
});
Configuration
The DebuggerPlugin function accepts an optional logLevel parameter that controls the verbosity of console output.
- JavaScript (tag)
- Browser (npm)
window.snowplow('addPlugin',
  "https://cdn.jsdelivr.net/npm/@snowplow/browser-plugin-debugger@latest/dist/index.umd.min.js",
  ["snowplowDebugger", "DebuggerPlugin"],
  [3] // Log level: 3 = debug (default)
);
import { newTracker } from '@snowplow/browser-tracker';
import { DebuggerPlugin } from '@snowplow/browser-plugin-debugger';
import { LOG_LEVEL } from '@snowplow/tracker-core';

newTracker('sp1', '{{collector_url}}', {
   appId: 'my-app-id',
   plugins: [ DebuggerPlugin(LOG_LEVEL.debug) ],
});
The available log levels are:
| Level | Value | Description |
|---|---|---|
none | 0 | Disables all logging |
error | 1 | Logs errors only |
warn | 2 | Logs errors and warnings |
debug | 3 | Logs errors, warnings, and debug messages (default) |
info | 4 | Logs all messages |