Signals integration
The Snowplow Inspector optionally integrates with Snowplow Signals to help validate your attribute and intervention definitions.
There are two ways to connect Inspector to Signals:
- Automatic: log into Snowplow Console via the extension. The extension will detect Signals instances for any organizations you have access to. For full functionality you will need to add API credentials for each organization in the extension options.
- Signals Sandbox: if you're trialing Signals using the Signals Sandbox, you can enter your Profiles API and credentials information in the extension options.
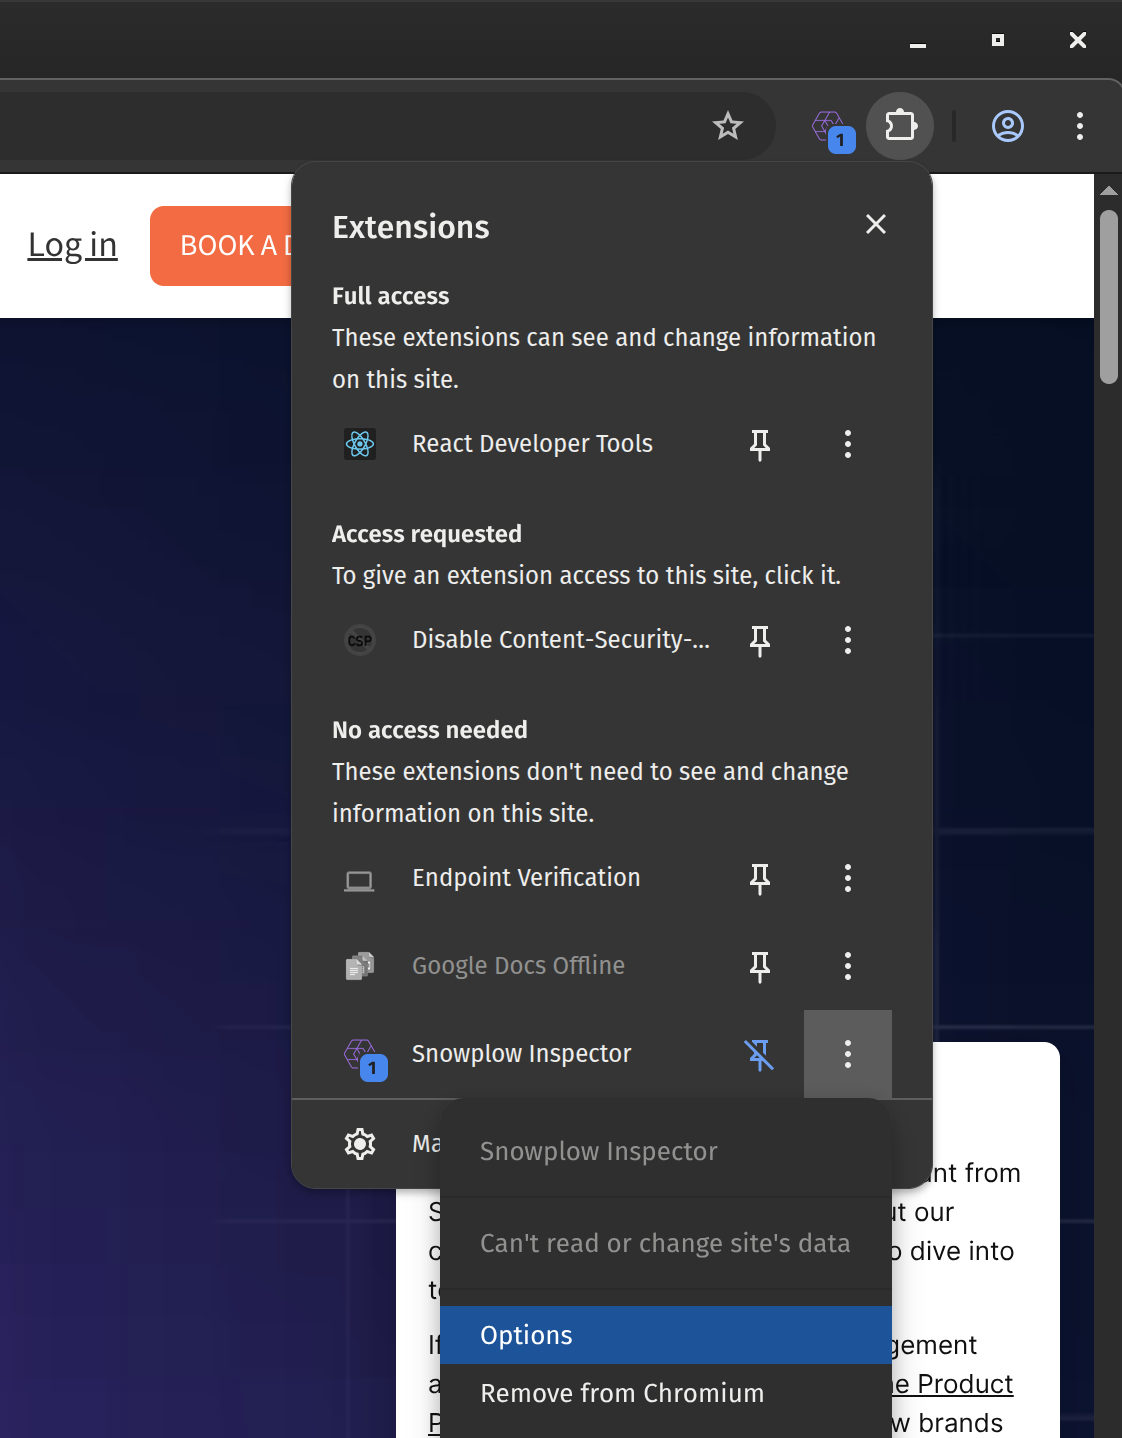
To access the extension options, use your browser toolbar to find the extensions menu, and access the Options for the Snowplow Inspector extension.
After connecting to Signals, the Inspector will use the Signals API to discover any defined attribute keys, and the definitions for your attribute groups. It uses these definitions with any events it has observed in the debugger to build a set of attribute keys.
By default Signals includes domain_userid as an attribute key.
Once the extension is aware of this, it will look at any events it observes, and build a list of unique domain_userid values it finds.
It then uses this list of attribute keys for requesting attributes and subscribing to interventions.
Signals functionality#
You can access Signals features by switching the vertical tabs down the left-hand side of the extension. The three tabs are: Events, Attributes, and Interventions.
Events is the usual event debugging functionality, and the other two interact with the Signals APIs.
Attributes#
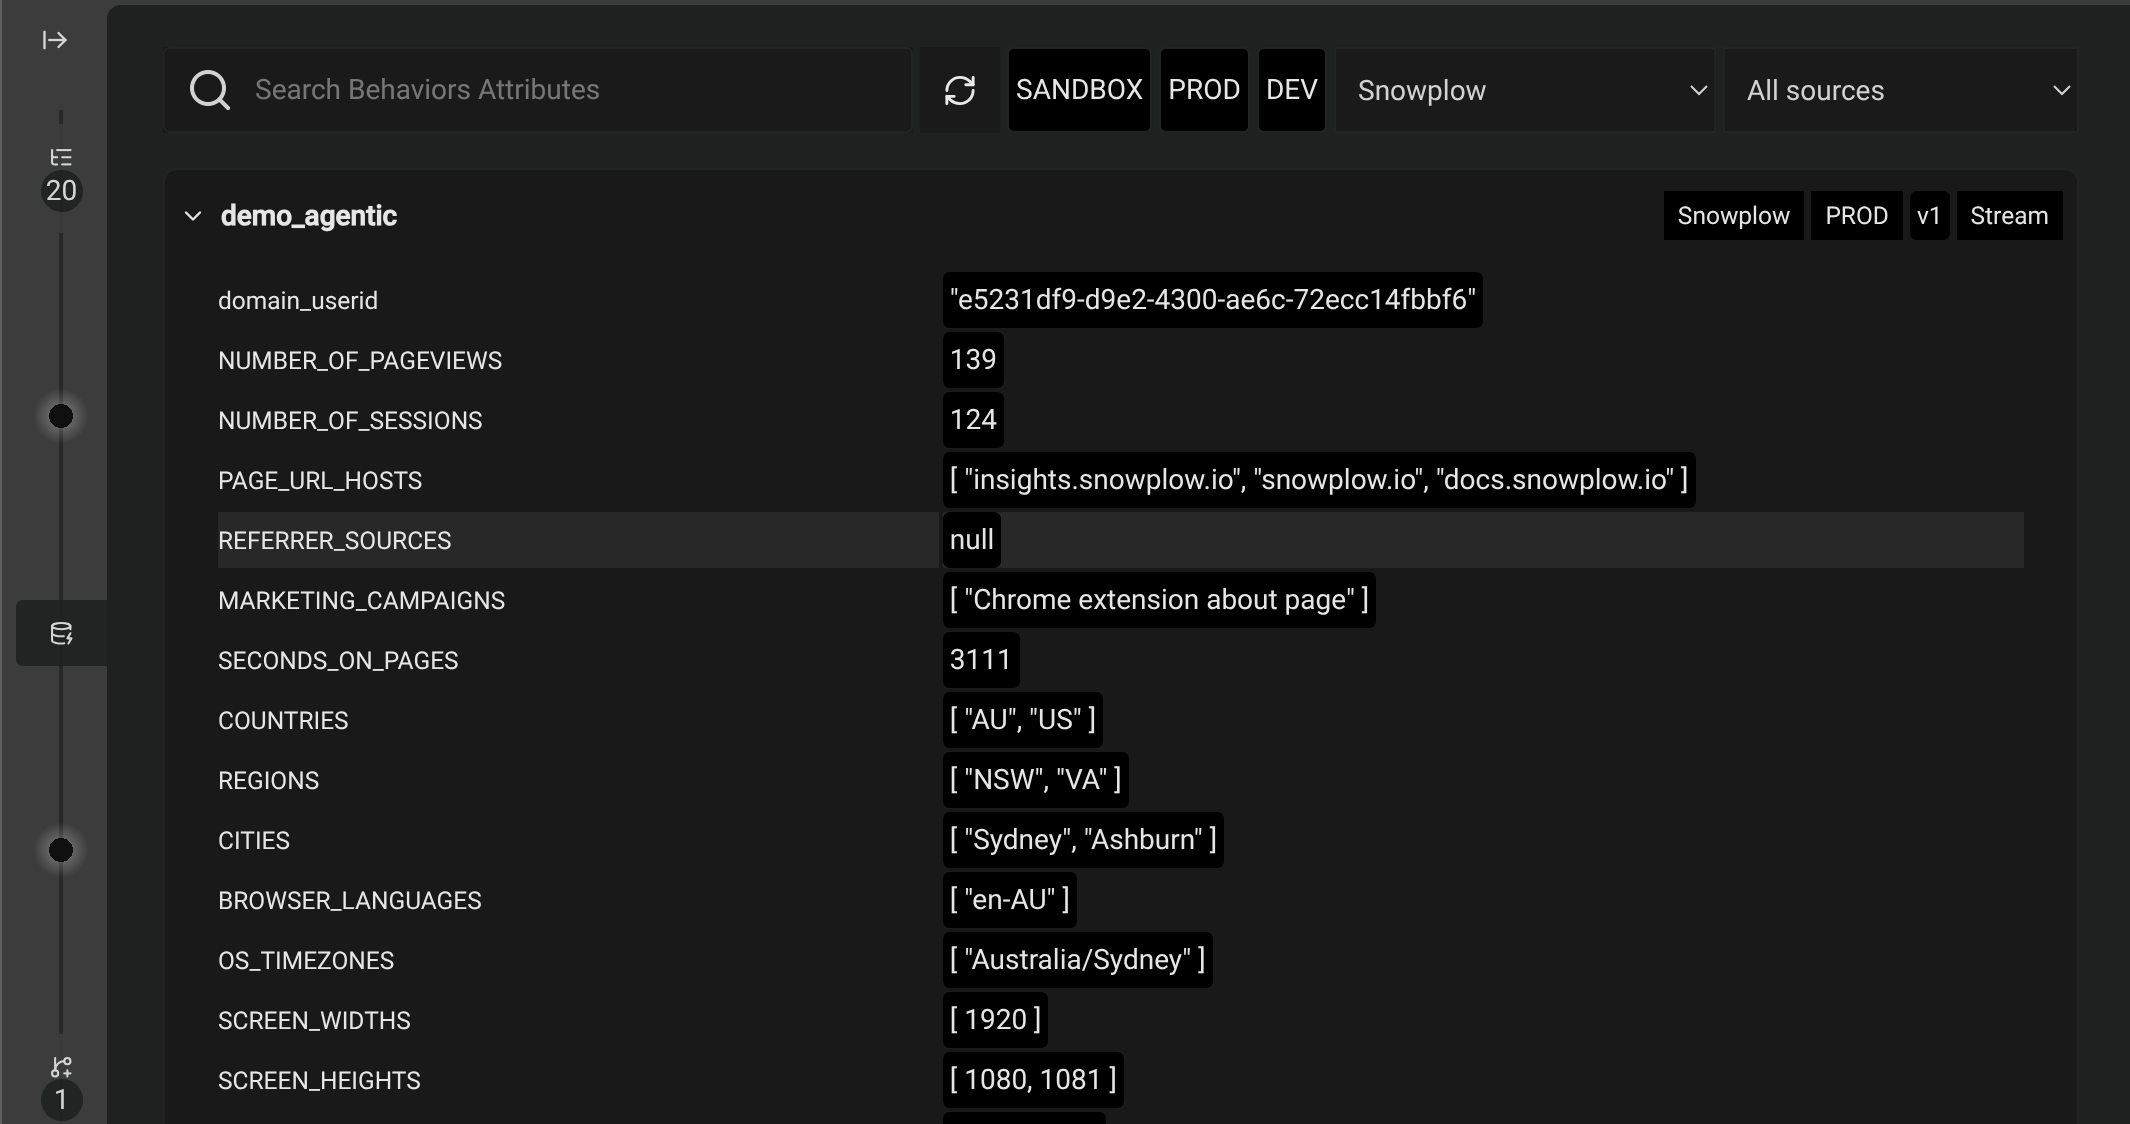
When you switch to the Attributes page in the extension, it will combine the attribute group definitions from the Signals API with the observed attribute keys, and then request the current profile values for each attribute key.
While you stay on the Attributes page, any new events that occur in the background (and increase the event counter on the Events tab) will automatically trigger a refresh. If there are no new events after 5 seconds, it will also do a final refresh, in case there was any latency in processing events and updating the values. Switching to the Events or Interventions tab and then back to the Attributes tab will initially show the most recently fetched values, while requesting any new updates in the background.
If the attribute values have still not updated or look out of date, you can use the refresh button at the top of the screen to manually trigger a refresh.
Since Signals Sandbox requests are free, attribute values get requested much more frequently than described here, to update as quickly as possible.
All attribute groups from all Signals instances get fetched if their configured attribute key has any values extracted from events. If you have access to many organizations, this may slow down the retrieval process. You can filter by environment, organization, or attribute source type to limit what's requested and displayed.
The controls at the top allow you to filter or search to filter what's displayed. Each attribute group listing includes its organization, environment, version, and source in the top-right for reference.
If you only have access to one organization, organization filters don't display. Similarly, if there is only a single version of an attribute group, there will be no option to change it.
If configured, Signals Sandbox counts as its own organization.
By default, the Inspector only fetches the highest version of each attribute group. If an attribute group has more than one version available, you can switch to an older version you're interested in to request that instead.
You can click a displayed attribute row to show the JSON definition for that attribute. Click the same row again to hide the definition.
Interventions#
As the extension builds its list of attribute keys based on observed events, it will automatically start intervention subscriptions for each attribute key found.
If an intervention triggers on a subscription, the interventions counter will increase and you can switch to this tab to view the intervention content of each observed intervention.
Clicking an intervention from the list of received interventions on the will display the contents, including the targeted attribute key and any associated attributes at the time of the intervention.
For rule-based interventions, you can also expand the definition of the intervention to see the logic used to trigger it.