Run the Flink live shopper features project
-
Run the startup script. This will:
- Ensure
.envfiles exist, copying from.env.exampleif needed - Update Git submodules
- Start all the services defined in the Docker Compose files, in detached mode
bashup.sh - Ensure
-
Access the main interfaces:
- Web application ecommerce store:
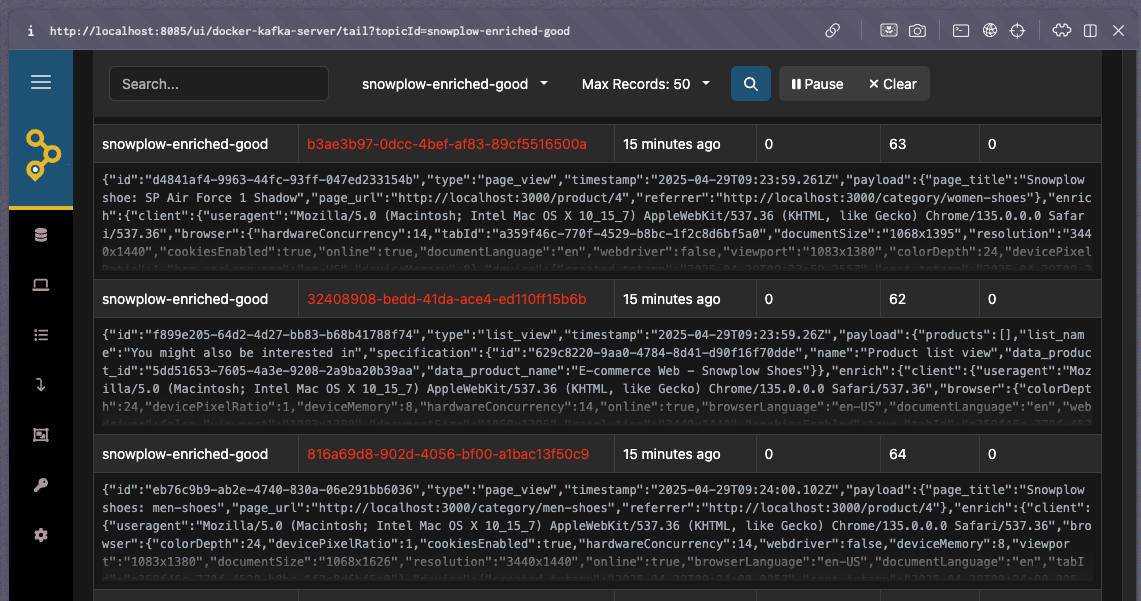
http://localhost:3000 - AKHQ (Kafka UI):
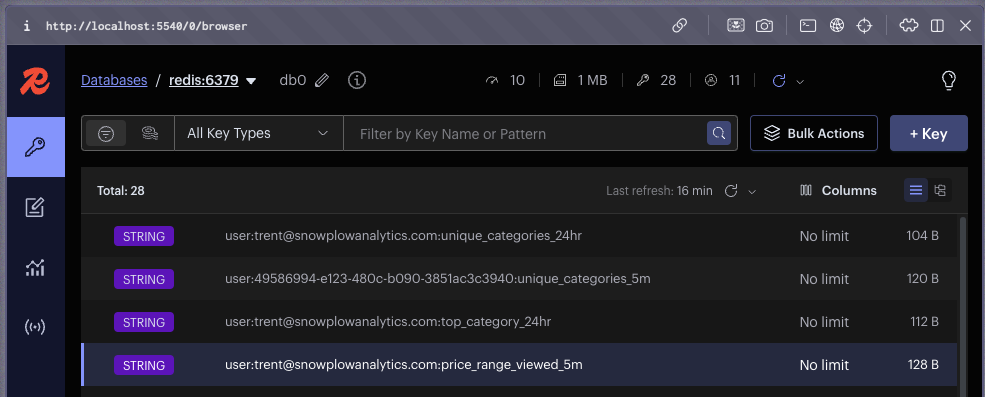
http://localhost:8085 - Redis Insights:
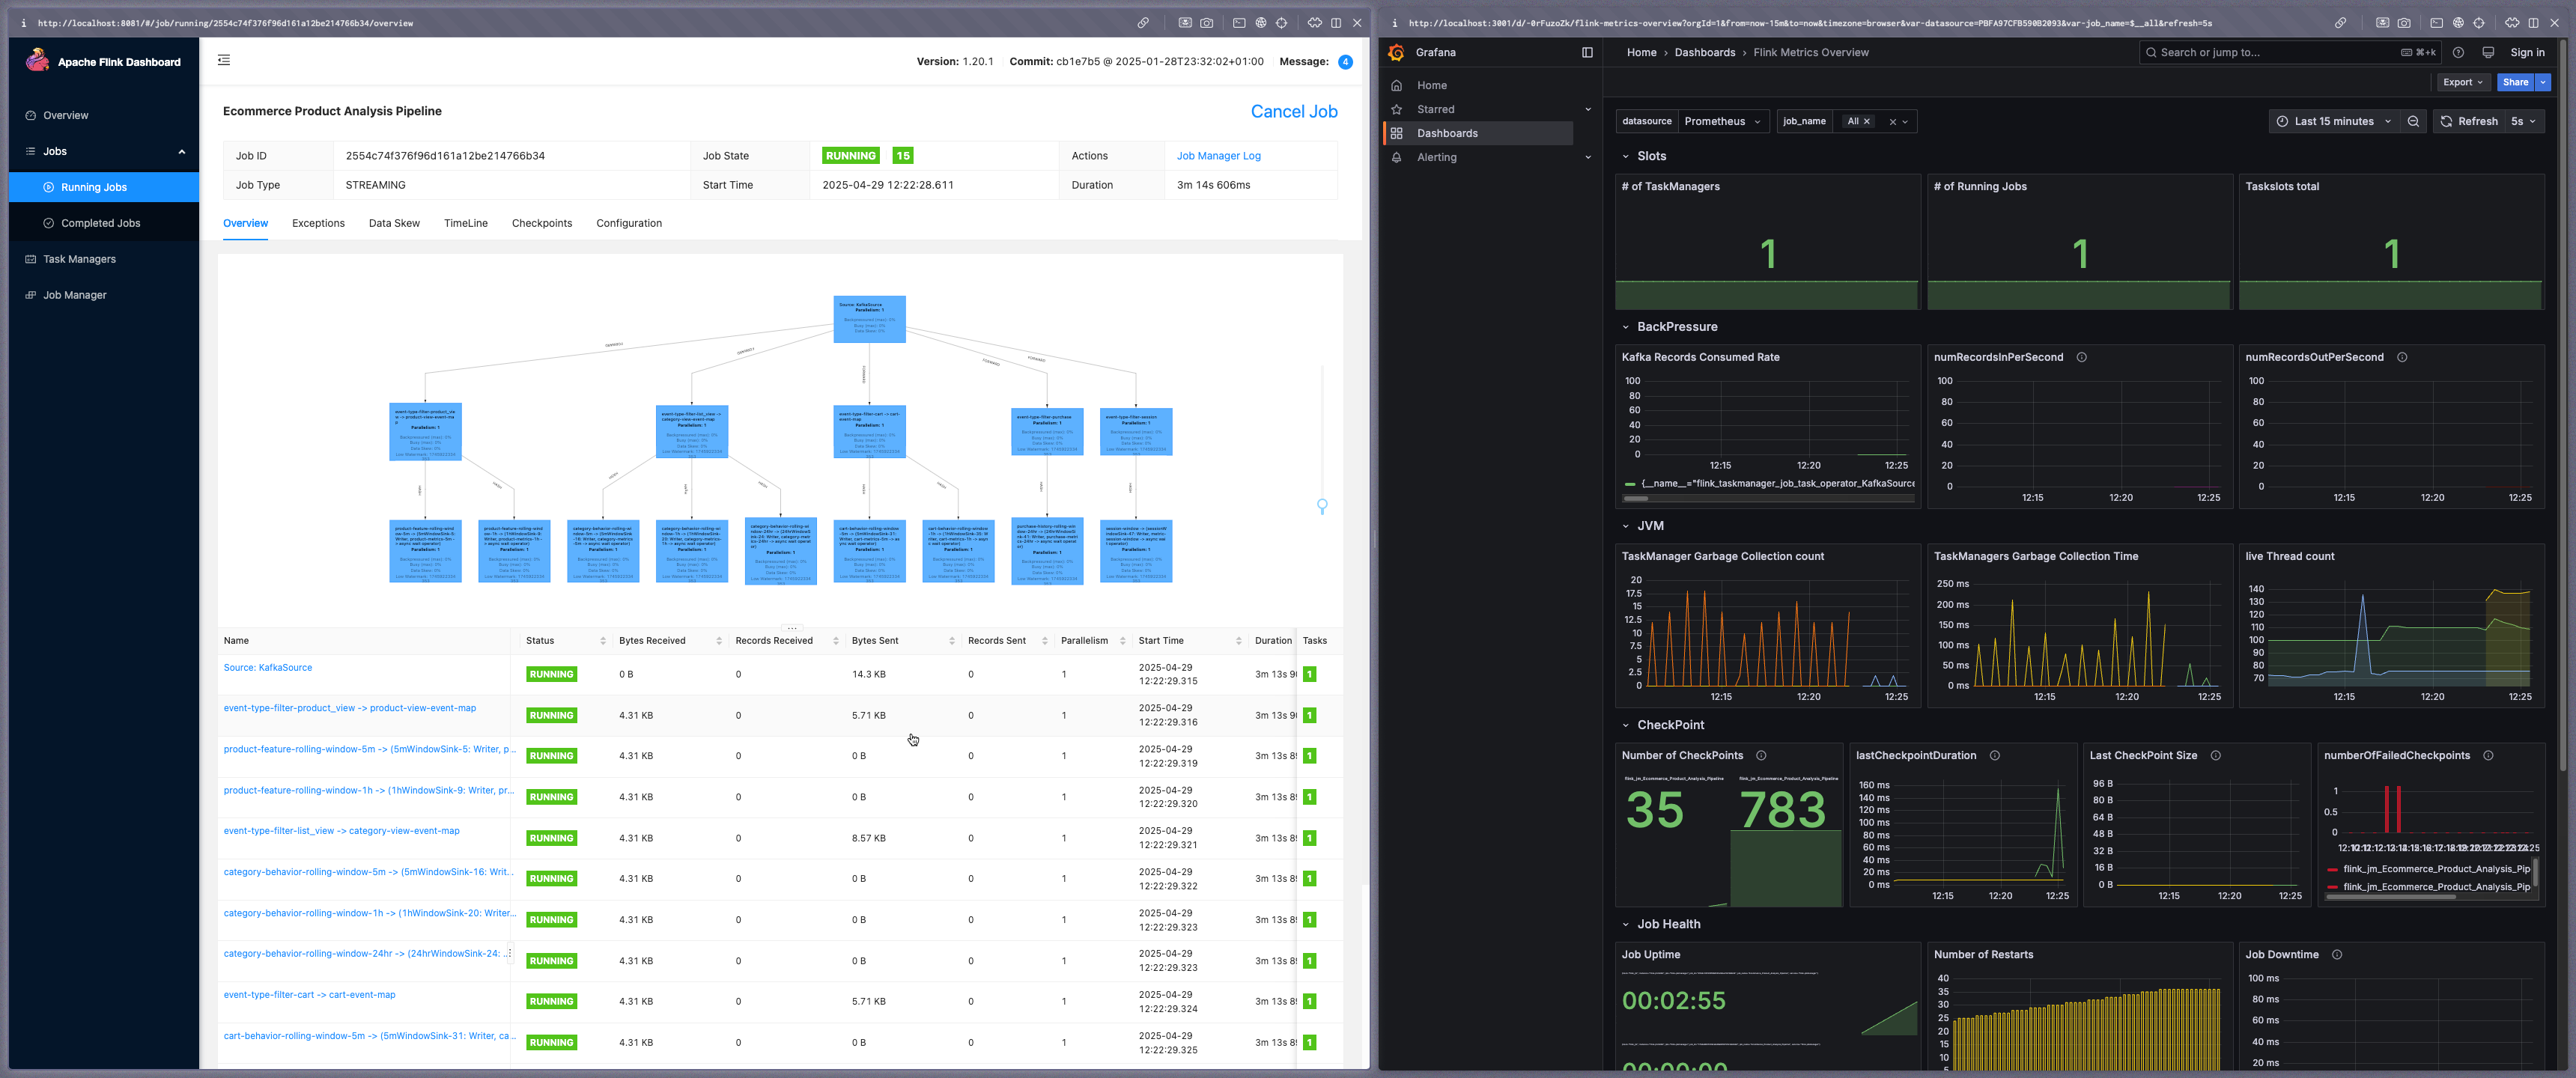
http://localhost:5540 - Flink dashboard:
http://localhost:8081 - Grafana:
http://localhost:3001
- Web application ecommerce store:
-
When finished, stop the containers
bashdocker compose down
Dataflow steps
-
Client-side tracking:
- The Next.js-based ecommerce store emits user interactions (e.g.,
product_view,add_to_cart) using the Snowplow JavaScript tracker
- The Next.js-based ecommerce store emits user interactions (e.g.,
-
Ingestion pipeline:
- Events are captured by the Collector and processed via Enrich
- Snowbridge forwards enriched events into Kafka topics
-
Stream processing (Apache Flink):
- Events are parsed, filtered, and routed into logical branches
- Processing includes:
- Product features: count views, average viewed price, price range
- Cart behavior: add/remove counts, cart value, update frequency
- Category engagement: category views, repeat views
- Purchase history: aggregate purchases over rolling windows (e.g., 24 hours) to calculate total spend, order count
- Session analytics: duration, bounce rate, marketing source
-
Feature store (Redis):
- Metrics are written to Redis using deterministic keys (e.g.,
user:{user_id}:{feature}_{window}) - These metrics are available for real-time lookups by downstream systems
- Metrics are written to Redis using deterministic keys (e.g.,
Testing
To test the system, log in to the ecommerce store using one of the mock users.
Open a product listed on the homepage. You should see data flowing to the enriched-good topic via AKHQ. This is the same data ingested by Flink to derive metrics.
All calculated metrics will appear in Redis Insights.
If you don't see any data flowing, check that the ecommerce store is sending events correctly. Ad blockers can interfere with event tracking: turn them off for full functionality.
The data in Redis is now available to be consumed by any application, system, or process—for example, an AI agent can use this data to determine the next best action.