Understand the live shopper feature calculations
This section explains what is calculated, how each metric is updated, and where the values are stored.
- Metrics are calculated in-stream, so they’re always fresh
- Rolling windows offer an up-to-date view over the last N minutes or hours
- Session windows account for user inactivity, producing clean session data
- Redis keys are predictable, making metrics easy to use across services
How features are calculated
Everything starts with the entry point class com.evoura.snowplow.SnowplowAnalyticsPipeline, which is responsible for:
- Creating a Kafka source (a Flink operator to read the data)
- Parsing the data into a known object (
com.evoura.snowplow.model.SnowplowEvent) - Branching the data for multiple windowed calculations
- Defining how each window processes the data
- Sinking the features into Redis
At a high level, the workflow is:
- The Snowplow tracker sends raw events to the Snowplow pipeline, which processes them and forwards them to Flink
- Flink parses events, assigns more timestamps, and sends each event down a dedicated branch
- Each branch runs a windowed function that maintains just enough state to update the metric
- The function emits a
MetricValueobject at a fixed cadence (30 seconds or 1 minute) - Flink writes the metric to Redis using a predictable key (
user:{id}:feature:{name}_{window})
Window types
| Window type | Purpose | Size | Emit every | Ends when | Used in |
|---|---|---|---|---|---|
| Rolling | Continuous, sliding view | 5 m, 1 h, 24 h | 30 s or 1 min | Never; always shifts | Product, Category, Cart, Purchase |
| Session | Group events per visit | Gap-based (30 min idle) | 30 s | No events for 30 min | Session metrics |
This architecture diagram shows more details about the windowing logic:
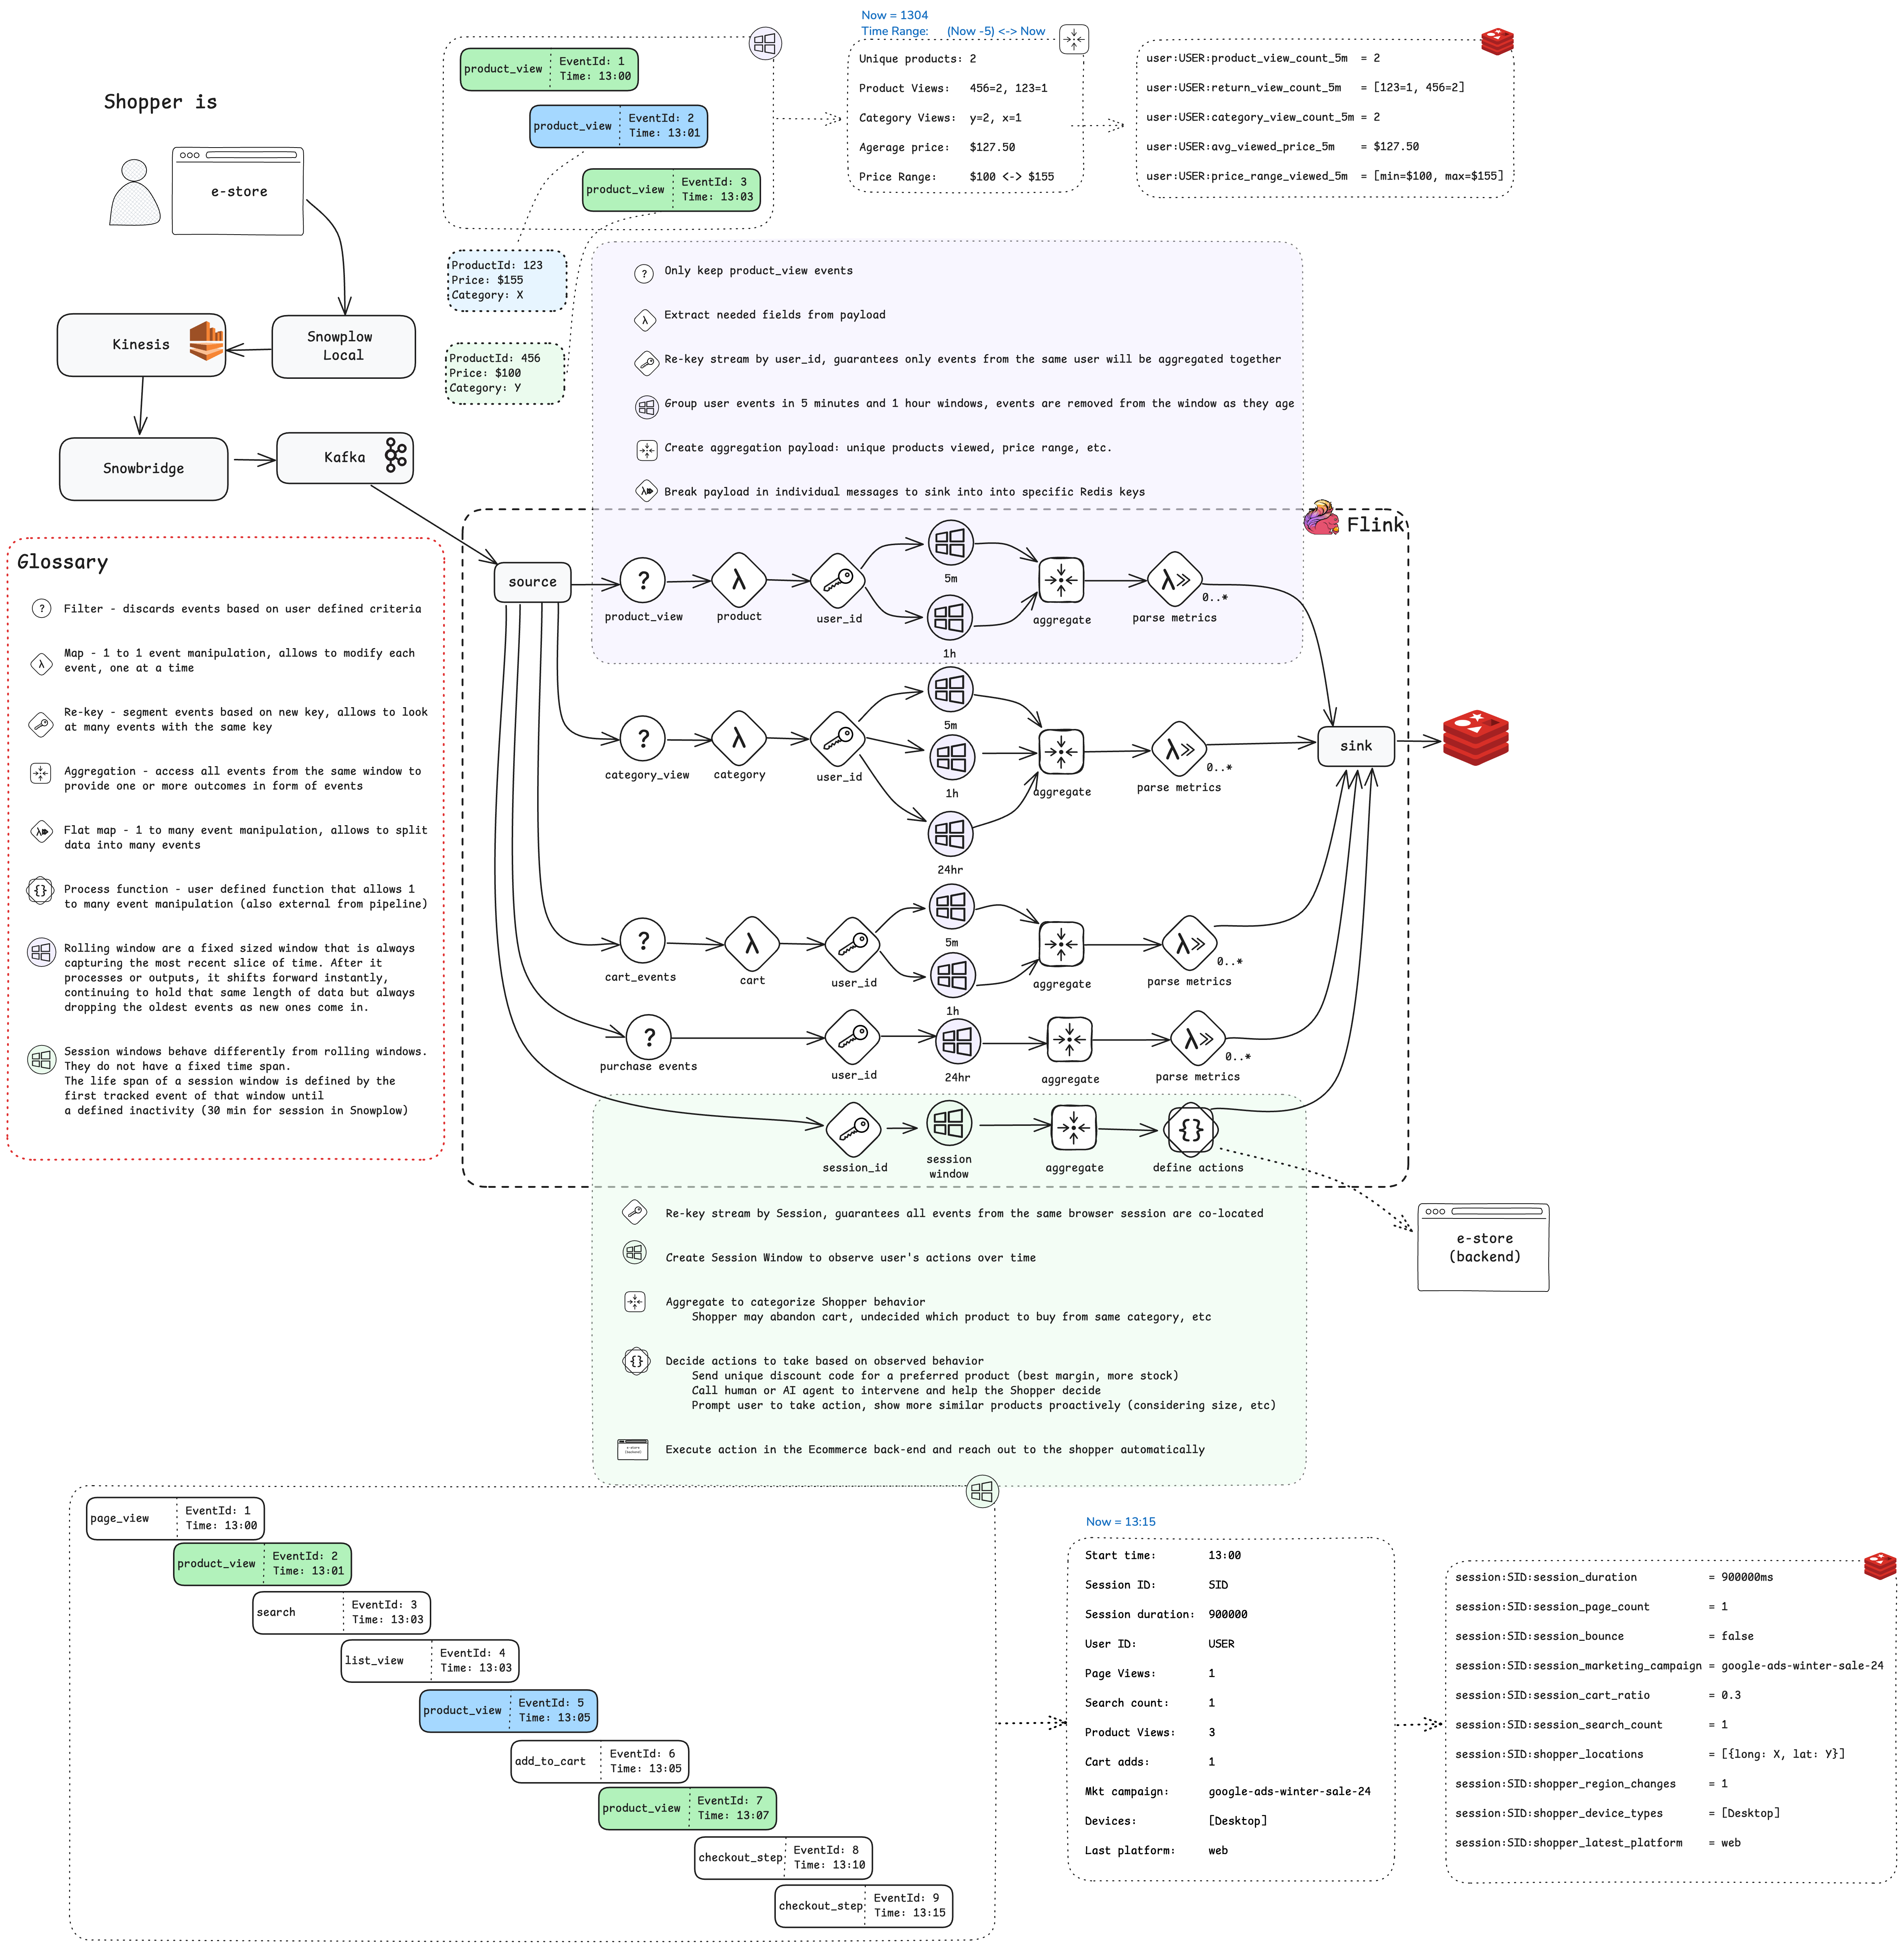
- All rolling windows use a custom
RollingWindowProcessFunction - The session view uses
SnowplowSessionWindow
For example, aggregation on a rolling window of 5 seconds and a session window with a 3-second gap would look like:
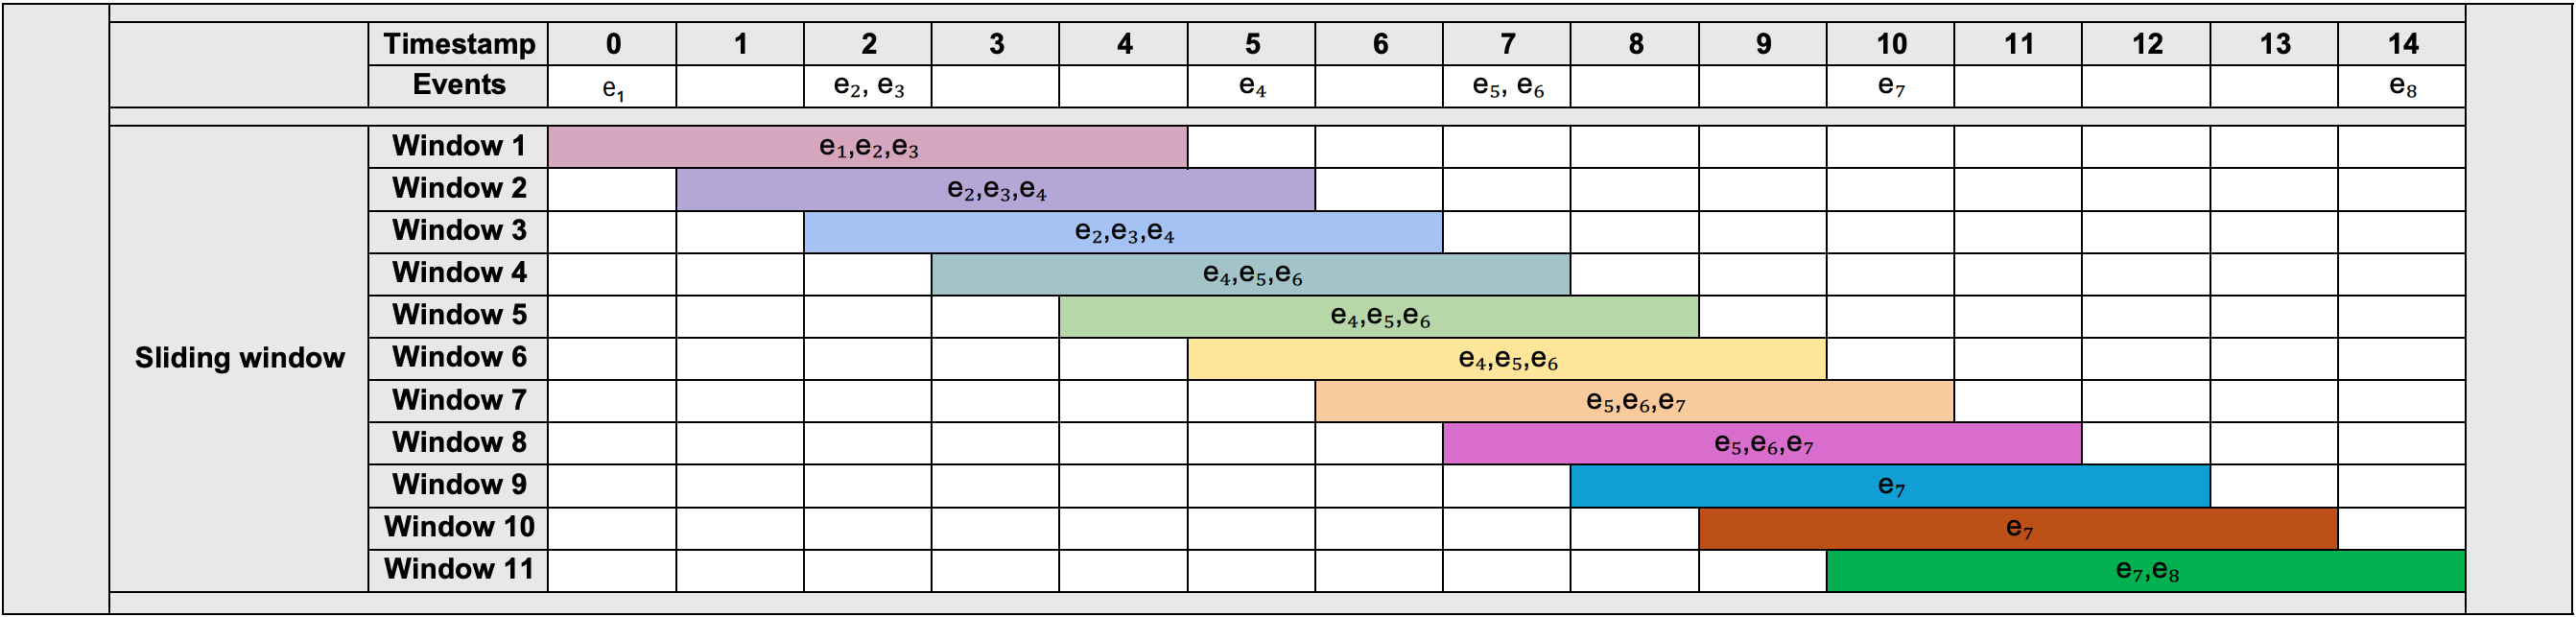

More detail is available in The case for a custom window in Flink: Expanding your streaming use-cases blog post.
Per-feature logic
Product views
- Event filter:
product_view - Key:
userId - Windows: 5 min, 1 hour
- Metrics: view count, average price, min-max price range
Emitted as:
product_view_count_5m,avg_viewed_price_1h, etc.
Category engagement
- Event filter:
list_view,product_view - Key:
userId - Windows: 5 min, 1 hour, 24 hour
- Metrics: category view count, repeat views, top category in window
Cart behavior
- Event filter:
add_to_cart,remove_from_cart - Key:
userId - Windows: 5 min, 1 hour
- Metrics: adds, removes, net cart value, cart change frequency
Purchase history
- Event filter: checkout events (
add_to_cart,remove_from_cart,checkout_step) - Key:
userId - Window: 24 hour
- Metrics: order count, total spend, average order value
Session analytics
- Event filter: all high-level engagement events
- Key:
sessionId - Window: session gap (30 min)
- Metrics: session duration, pages per session, bounce flag, cart-to-page ratio
Redis key pattern
user:{user_id}:{feature}_{window}
Examples:
user:trent@snowplowanalytics.com:product_view_count_5muser:lucas@snowplowanalytics.com:session_duration
Downstream apps such as dashboards, ML models, or chat bots read these keys directly.