Snowplow Mini
Snowplow Mini is a single-instance version of Snowplow that primarily serves as a development sandbox, giving you a quick way to debug tracker updates and changes to your schema and pipeline configuration.
Snowplow Mini is similar to Snowplow Micro, with the following differences:
- Micro is more portable and can easily run on your machine or in automated tests.
- Mini has more features, mainly an OpenSearch Dashboards UI, and is better integrated with Snowplow BDP.
You might use Snowplow Mini when:
- You've updated a schema in your Development environment and wish to send some test events against it before promoting it to Production
- You want to enable an Enrichment in a test environment before enabling it on Production
Getting started
Snowplow BDP users can request a Snowplow Mini instance through the console (go to “Environments” → “Sandboxes” → “Setup a sandbox”).
For Community Edition, see the setup guides for AWS and GCP.
Conceptual diagram
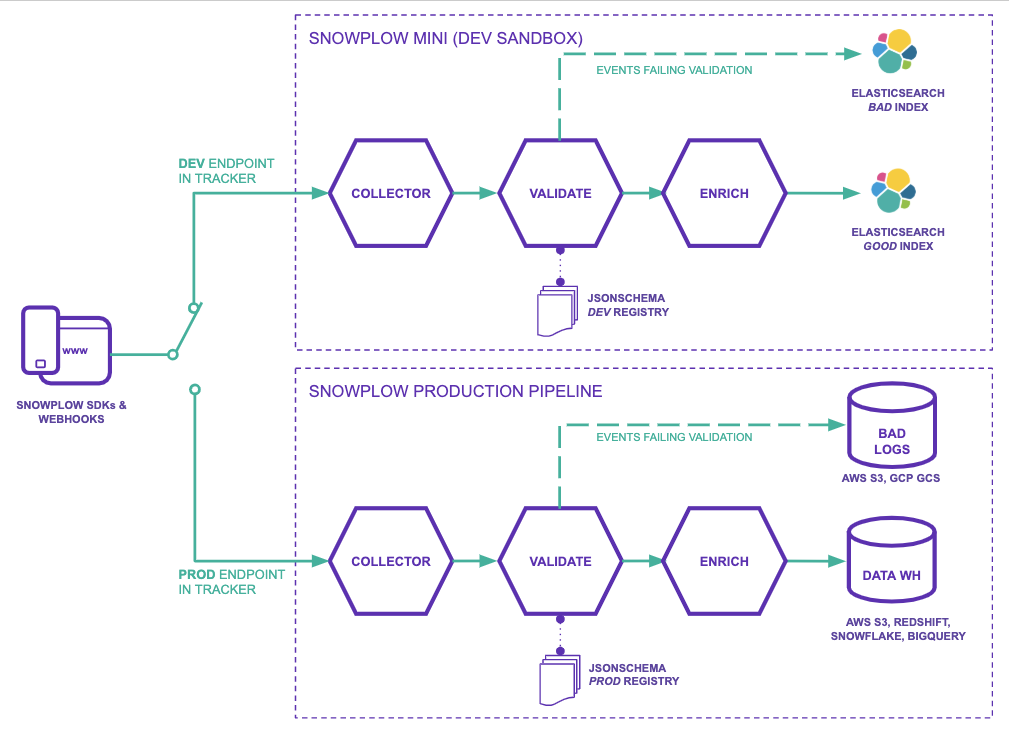
The diagram above illustrates how Snowplow Mini (top) works alongside your Production pipeline (bottom).
By pointing your tracker(s) to the Collector on your Snowplow Mini you can send events from your applications development and QA environments to Snowplow Mini for testing.
Once you are happy with the changes you have made you would then change the trackers in your application to point to the Collector on your Production pipeline.
Features of Snowplow Mini
- Data is tracked and processed in real time
- Your Snowplow Mini speaks to your Schema registries to allow events to be sent against your custom schemas
- Data is validated during processing
- Data is loaded into OpenSearch and can be queried directly or through the OpenSearch Dashboard
- Successfully processed events and failed events are in distinct good and bad indexes
Topology
Snowplow-Mini runs several distinct applications on the same box which are all linked by NSQ topics. In a production deployment each instance could be an Autoscaling Group and each NSQ topic would be a distinct Kinesis Stream.
- Scala Stream Collector:
- Starts server listening on
http://< sp mini public ip>/which events can be sent to. - Sends "good" events to the
RawEventsNSQ topic - Sends "bad" events to the
BadEventsNSQ topic
- Starts server listening on
- Stream Enrich:
- Reads events in from the
RawEventsNSQ topic - Sends events which passed the enrichment process to the
EnrichedEventsNSQ topic - Sends events which failed the enrichment process to the
BadEventsNSQ topic
- Reads events in from the
- OpenSearch Sink Good:
- Reads events from the
EnrichedEventsNSQ topic - Sends those events to the
goodOpenSearch index - On failure to insert, writes errors to
BadElasticsearchEventsNSQ topic
- Reads events from the
- OpenSearch Sink Bad:
- Reads events from the
BadEventsNSQ topic - Sends those events to the
badOpenSearch index - On failure to insert, writes errors to
BadElasticsearchEventsNSQ topic
- Reads events from the
These events can then be viewed in Kibana at http://< sp mini public ip>/kibana.