Run the application using Snowplow Micro and ClickHouse
The following steps will deploy the solution accelerator using Docker.
Step 0: Prerequisites
- Open a terminal
- Install Docker and Docker Compose. You can run the following commands to check if it's already installed. If not installed, you can install Docker / Docker Compose by following these instructions.
  docker --version

  docker-compose --version
- Clone the project and navigate to its directory
git clone https://github.com/snowplow-industry-solutions/clickhouse-realtime-editorial-analytics.git
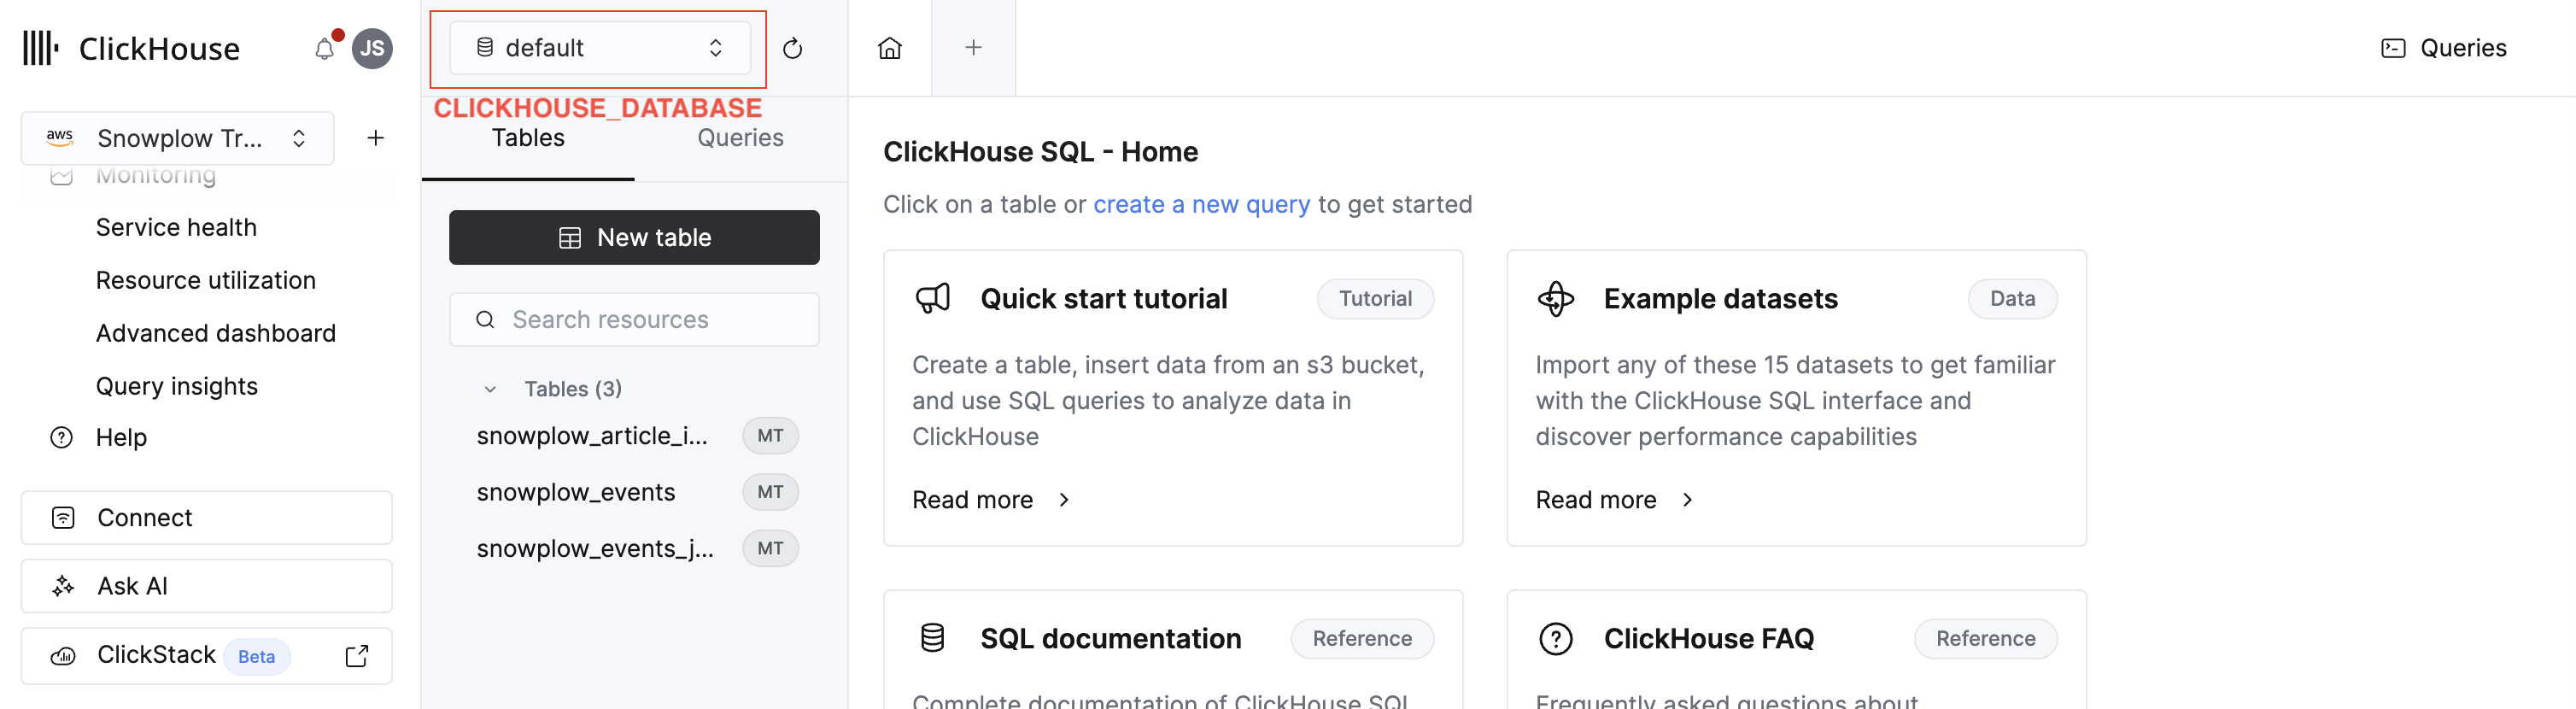
- Run the SQL query in
./clickhouse-queries/create-table-query.sqlwithin ClickHouse's SQL console. This table will store the Snowplow events. You'll need aCLICKHOUSE_DATABASEvalue in the next step. It's labeled in this image:
- Create a
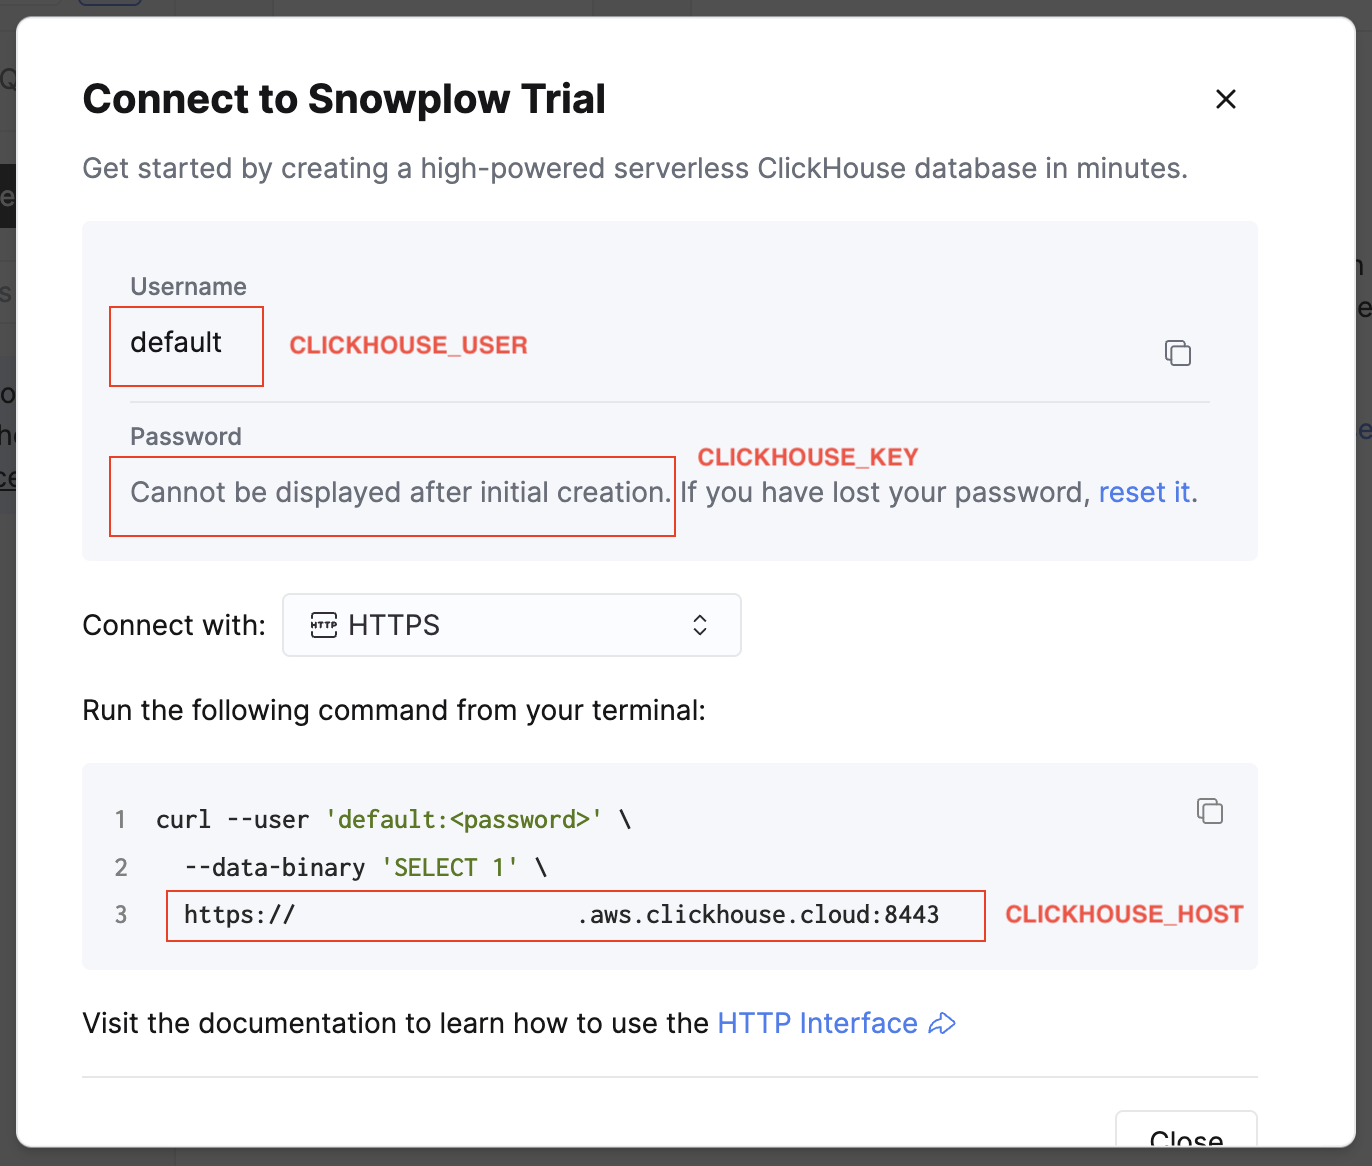
.envfile by copying.env.example. To populate the values, go to your ClickHouse account and select the HTTPS connection method. This will display a samplecurlcommand containing your connection details.
Map each value to the correct environment variable:
| Variable | Where to find it |
|---|---|
CLICKHOUSE_HOST | Line 3 of the sample curl command. Format: https://<your-clickhouse-host>.aws.clickhouse.cloud:<port> |
CLICKHOUSE_USER | The Username field |
CLICKHOUSE_KEY | The Password field |
CLICKHOUSE_DATABASE | The database name from the SQL Console where the SQL query was run. This is typically default |
CLICKHOUSE_TABLE | Always set this to snowplow_article_interactions |
Step 1: Start the containers
Run the following command to download and run everything in Docker:
docker-compose up -d
The architecture section on the previous page has the details on everything that's installed.
Step 2: Open the web tracking front-end
Wait for about 30 seconds for the website container to start. Once it's ready, visit http://localhost:3000 to view the website application and start tracking events.

2.1 Click on any of the articles that are on the homepage. Scroll down on the new page which opens. Wait for about 10 seconds to simulate a user reading.
2.2 Click on the advertisement which appears on the right-hand sidebar. Return to the homepage by clicking the The Daily Query logo in the header.

2.3 Select a different article from the homepage. Scroll down on the new page which opens. Wait for about 10 seconds to simulate a user reading.
2.4 Click on the advertisement which appears on the right-hand sidebar as you did in Step 2.2. Return to the homepage by clicking the The Daily Query logo in the header.
Step 3: Open the Snowplow Micro front-end
Open Snowplow Micro on http://localhost:9090/micro/ui in a separate window. Press the Refresh button located in the header. This will display the current Snowplow events which are being tracked (e.g. page_view, page_ping, article_interaction, ad_interaction).
You can use the Pick Columns button to select certain dimensions. Try selecting the following:
event_namefrom the "Events" sectioncom_demo_ad_interaction_1.typefrom the "Events" sectioncom_demo_media_article_interaction_1.typefrom the "Events" sectioncom_demo_media_article_1.titlefrom the "Entities" section
Step 4: Query the data in ClickHouse Console
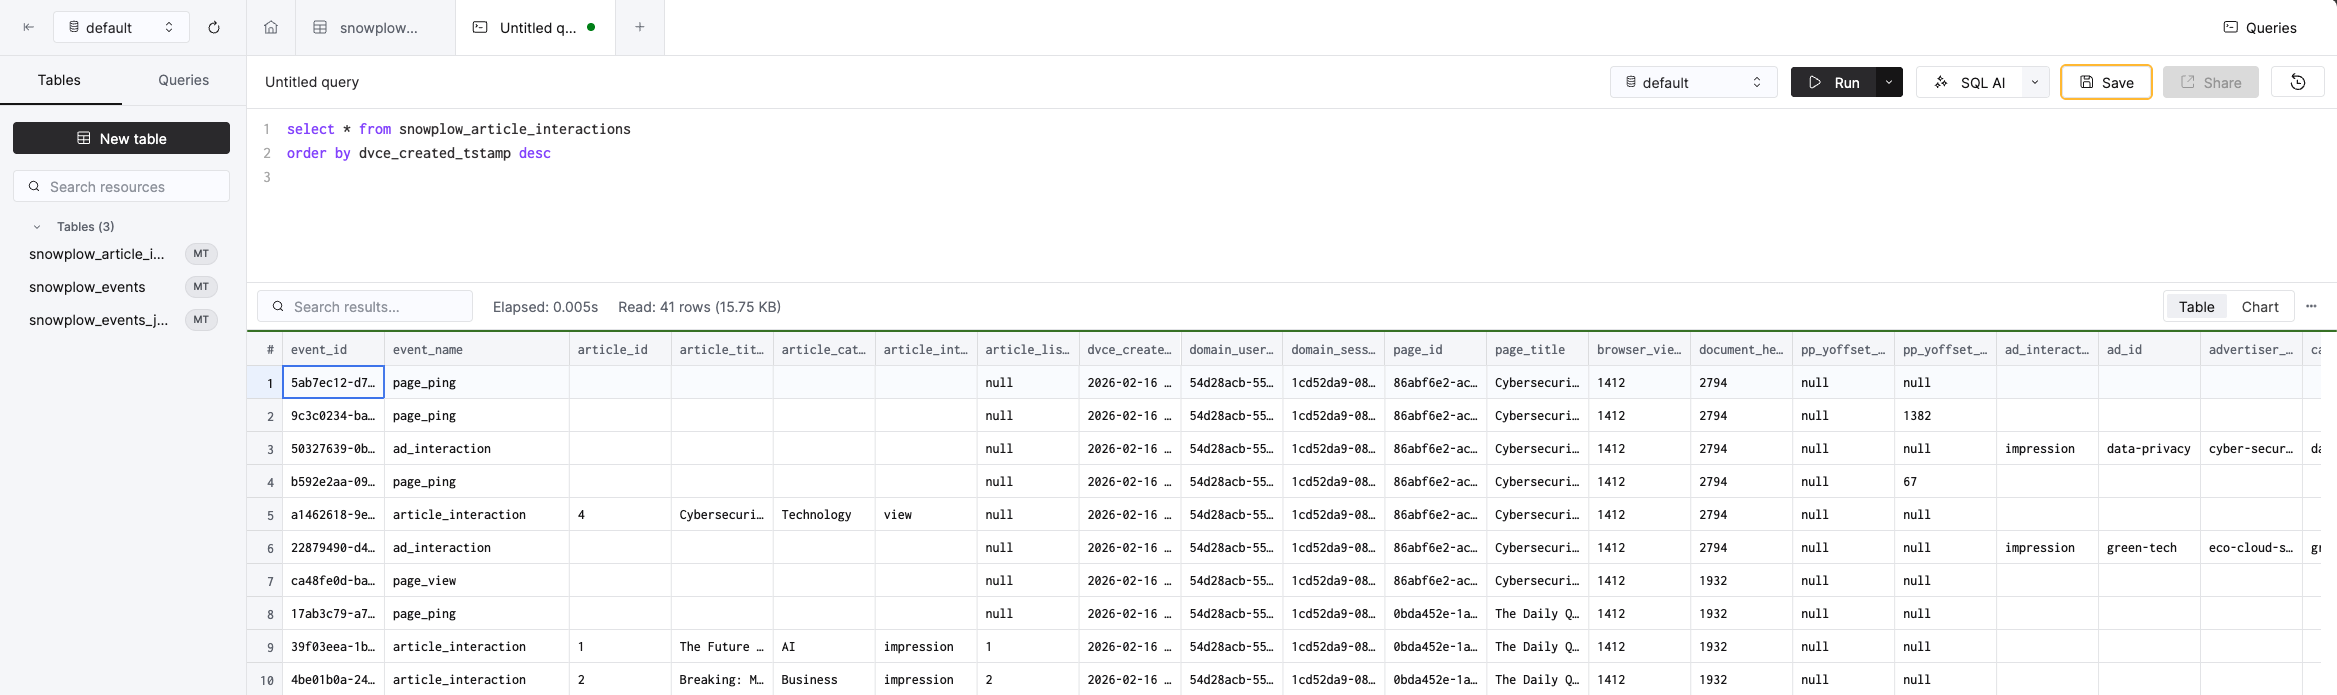
Run the following query in ClickHouse's SQL Console. You should see events landing in real-time within the ClickHouse table.
select * from snowplow_article_interactions
order by dvce_created_tstamp desc
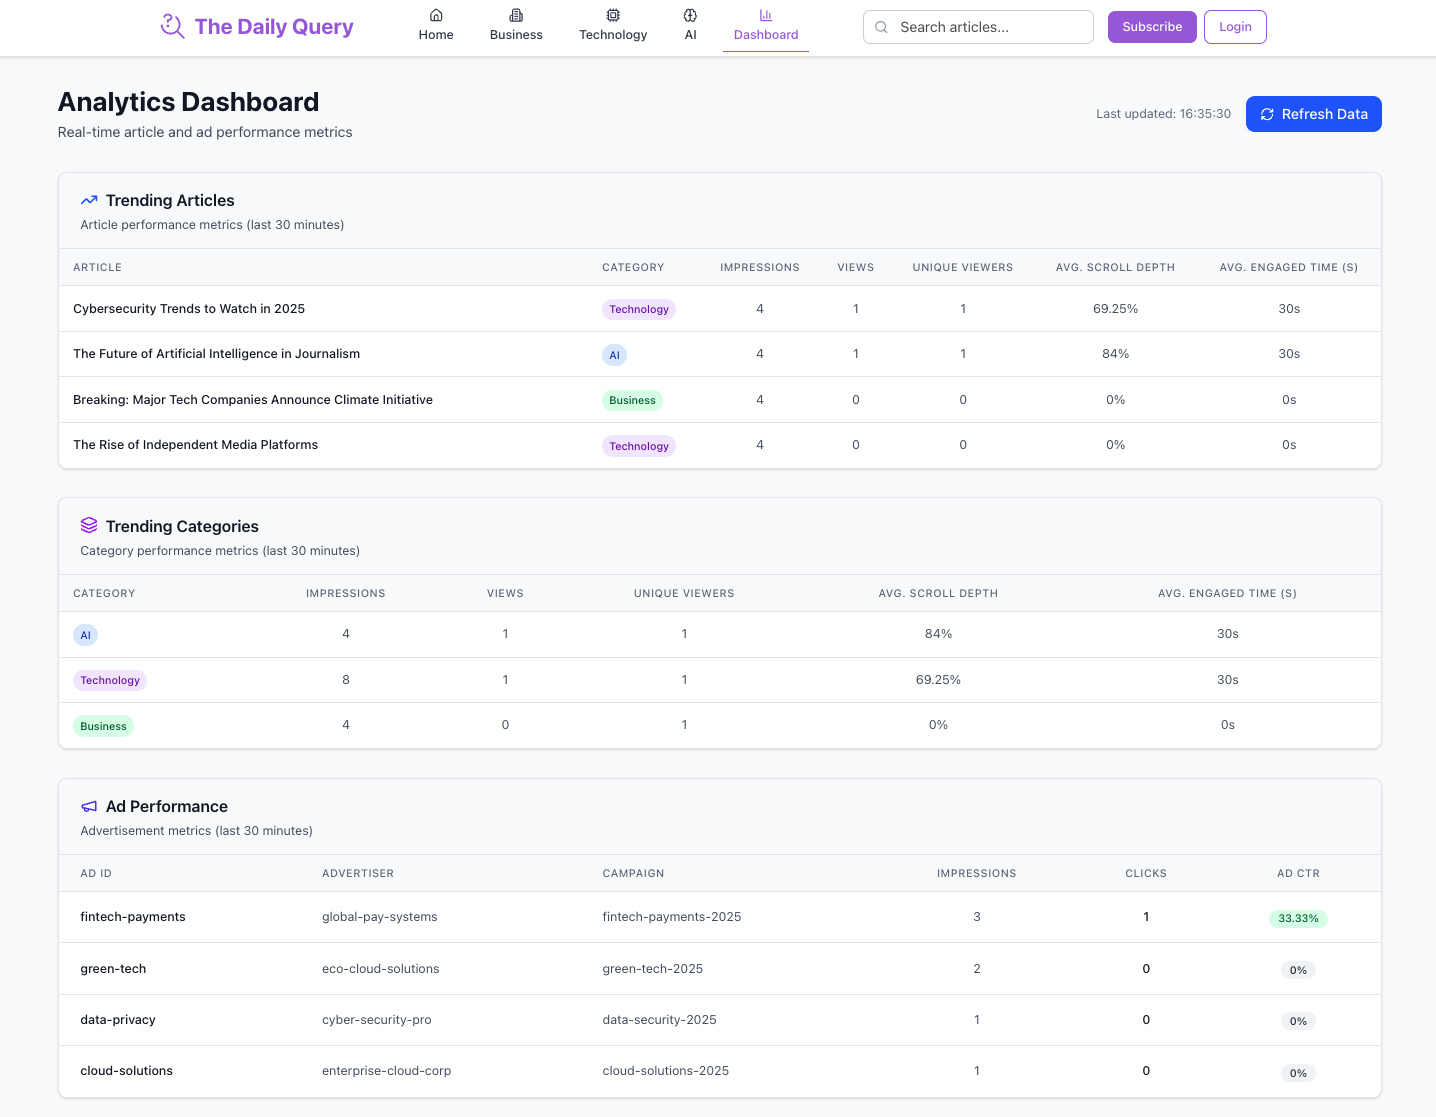
Step 5: View the editorial analytics data in a sample real-time dashboard
Visit the real-time editorial analytics dashboard at localhost:3000/dashboard, which is querying data from ClickHouse. Press the Load Data button to see the article engagement and ad performance metrics for the last 30 minutes.
If you're interested in the queries powering these insights, take a look at the code here:
Step 6: Generate more insights
Try selecting different news articles, or clicking on different displayed ads. Repeat Step 4 or Step 5 and the data will refresh in real-time.
Clean up and delete
Shut down and delete all running containers:
docker-compose down
There will still be data in your ClickHouse Cloud account. If you want to delete the generated data, run the following command in ClickHouse's SQL Console:
DROP TABLE snowplow_article_interactions