Event specification validation results in Console
Event specification validation results are now visible in Console. Until now, you had to look for them in your warehouse. Console shows how many events matched each tracking plan and event specification, and how many of them passed or failed validation, next to the tracking plans and event specifications themselves.
Validation results in Console
Every event volume figure in Event Studio is split into four categories: valid events, inferred events, events with violations, and failed events. Metrics cover the last 30 days, and you can switch between pipelines.
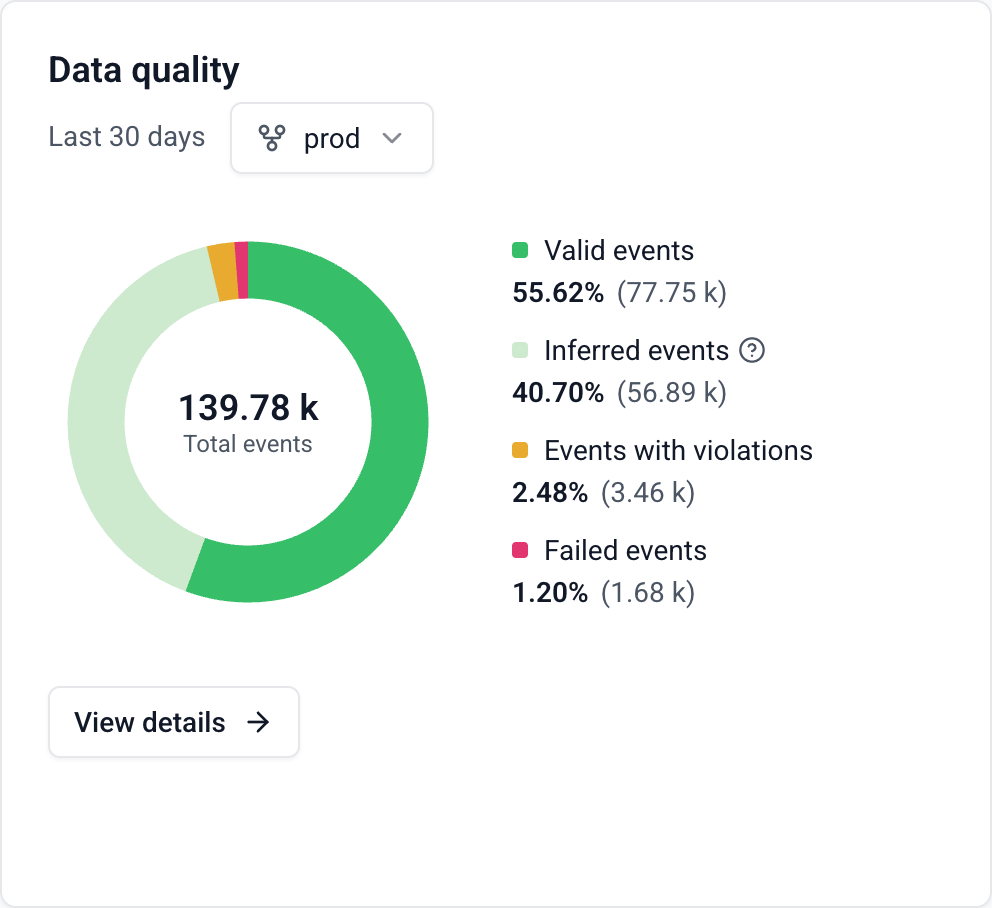
- Tracking plan page: a new Data quality panel shows the breakdown for the whole plan, with a link to the data quality dashboard
- Tracking plans list and Event Catalog: the volume column shows the breakdown for each tracking plan and event specification
- Tracking summary tab: each event specification has a new tab with metrics per specification version and application ID. You can see which applications send which version, and whether an application sends the event without being listed in the specification
Failed event counts require the data quality dashboard to be connected to the selected pipeline. Whether an event that fails validation counts as a violation or as a failed event depends on the tracking plan's data quality rules.