Run Snowplow Micro locally
For general use, we recommend running Micro through Snowplow Console. However, running locally can be useful if you don’t have access to Console or need an advanced configuration.
The easiest way to run Micro locally is through Docker.

Run the following command:
docker run -p 9090:9090 snowplow/snowplow-micro:4.4.0
You should see output like this:
[INFO] com.snowplowanalytics.snowplow.micro.Run - No enrichments enabled
[INFO] com.snowplowanalytics.snowplow.micro.MicroHttpServer - Building blaze server
[INFO] org.http4s.blaze.channel.nio1.NIO1SocketServerGroup - Service bound to address /[0:0:0:0:0:0:0:0]:9090
A note on ports...
The command above will route port 9090 on your machine to Micro.
If that port is already taken, you will want to change it, like so:
docker run -p 5000:9090 snowplow/snowplow-micro:4.4.0
            ↑↑↑↑
Note that Micro will still log REST interface bound to /0.0.0.0:9090 — 9090 here refers to the port inside the container.
We will use 9090 in the examples below, but remember to substitute the port of your choosing.
We also provide a distroless image of Micro. Because it only includes the bare minimum, it’s smaller and more secure. However, the downside of using the distroless image is that basic utilities (such as a shell) are not available.
To use this image, add -distroless to the tag:
docker run -p 9090:9090 snowplow/snowplow-micro:4.4.0-distroless
If Docker is not available on your system, you can also run Micro as a Java application (since version 2.3.1). The jar files are availble via GitHub releases.
java -jar micro-4.4.0.jar
Most of the examples on this and the following pages will show the Docker option, but feel free to adapt them accordingly.
Sending events to Micro
Follow the documentation for one of our trackers to implement some tracking code on your website or application.
You can then point it to localhost:9090 where Micro is listening. For example, using the Browser tracker:
import { newTracker, trackPageView, enableActivityTracking } from '@snowplow/browser-tracker';

newTracker('snowplow', 'localhost:9090', {
  appId: 'my-app-id',
  plugins: [],
});

trackPageView();
enableActivityTracking({
  heartbeatDelay: 10,
  minimumVisitLength: 10,
});
Checking the results
Once you have the tracking code and the events are flowing in, you should see something like this in the Micro logs:
[INFO] EventLog - GOOD id:4bfd5b32-d02a-4f83-a731-4339898437e1 app_id:test type:page_view (iglu:com.snowplowanalytics.snowplow/page_view/jsonschema/1-0-0)
[INFO] EventLog - GOOD id:e7a5c64d-d0f7-48d9-9a50-be044db7d2f6 app_id:test type:page_ping (iglu:com.snowplowanalytics.snowplow/page_ping/jsonschema/1-0-0)
[INFO] EventLog - GOOD id:1608ca85-f5f9-4948-898a-728aa8f1131b app_id:test type:page_ping (iglu:com.snowplowanalytics.snowplow/page_ping/jsonschema/1-0-0)
This means your tracking is set up correctly and your events are valid (GOOD).
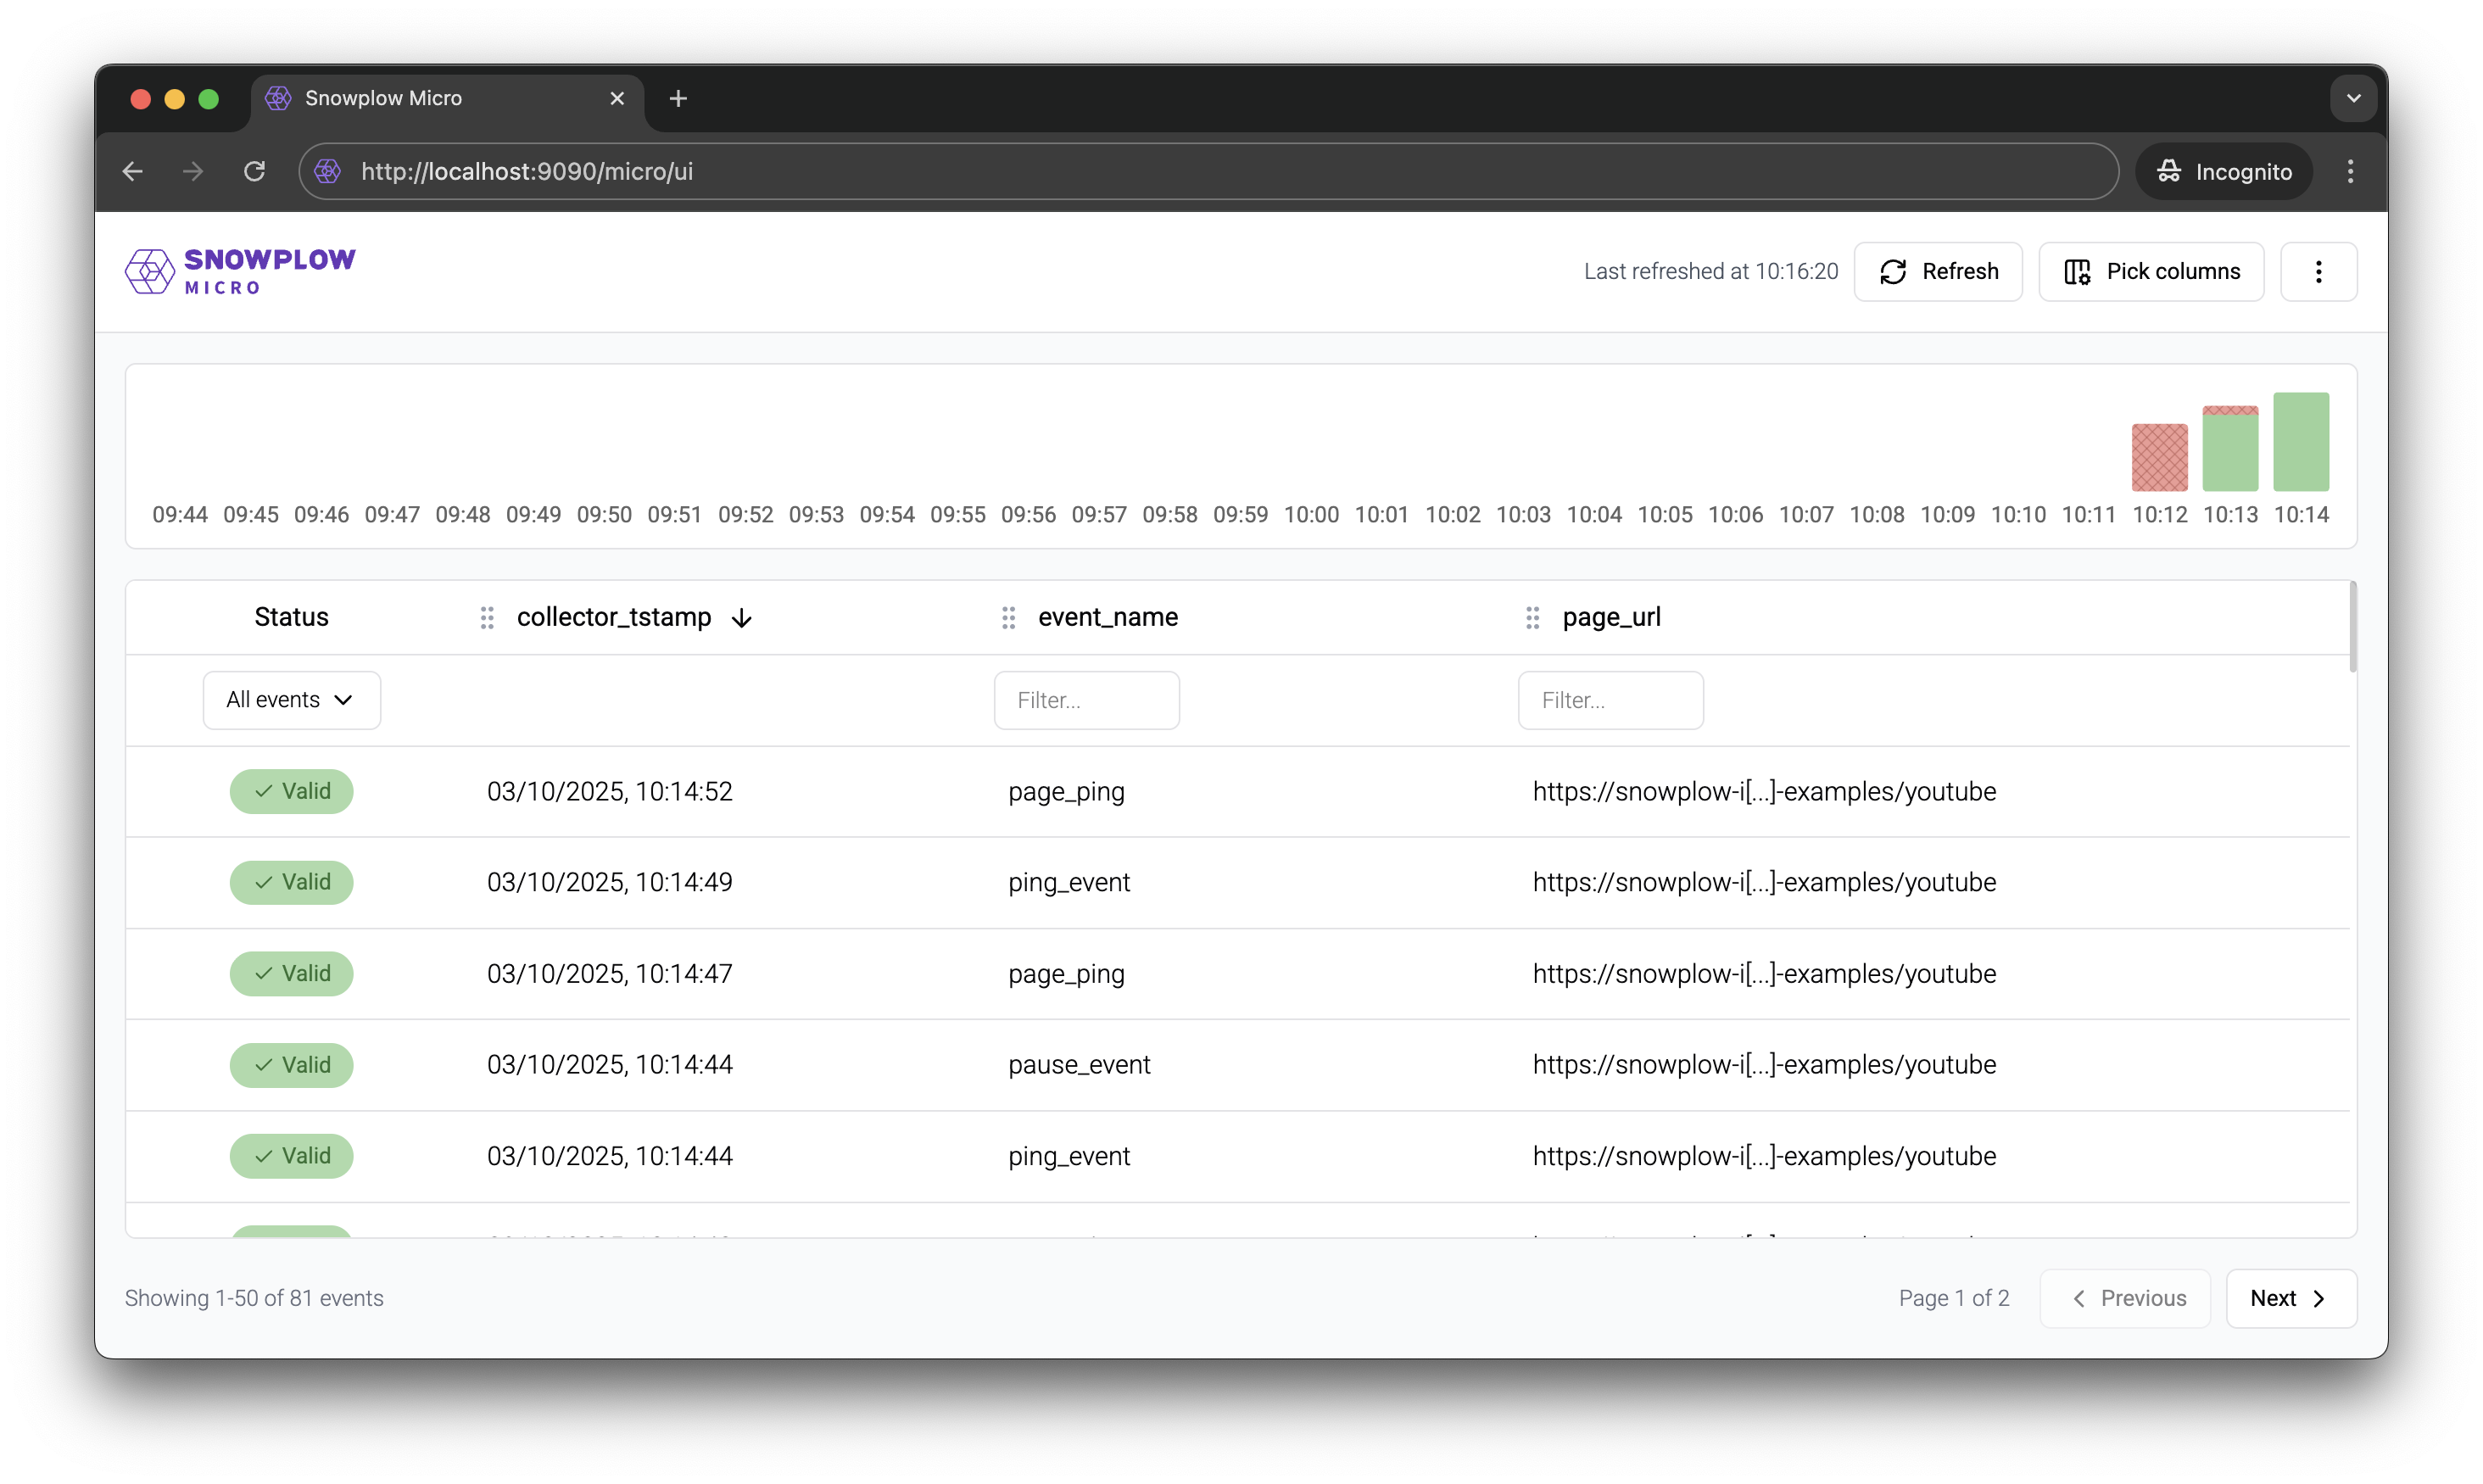
Would you rather see the events visually? Open http://localhost:9090/micro/ui in your browser. You might want to check a few tips on how to use the dashboard.
Alternatively, you can inspect the events via the API. For example, try:
curl localhost:9090/micro/good
Exporting events
Snowplow pipelines output data in the enriched TSV format. Typically, this is picked up by one of our loaders or by tools such as Snowbridge.
With Micro, you can see what your data would look like in this format — useful if you want to test any logic that is parsing this data.
docker run -p 9090:9090 snowplow/snowplow-micro:4.4.0 --output-tsv
Since version 2.4.0, you can alternatively output the data in JSON format (the same as provided in Snowplow Analytics SDKs):
docker run -p 9090:9090 snowplow/snowplow-micro:4.4.0 --output-json
Also since version 2.4.0 you can send the data in either format to an HTTP endpoint, rather then standard output:
docker run -p 9090:9090 snowplow/snowplow-micro:4.4.0 --output-tsv \
--destination http://some-url.com
Output vs logs
The TSV or JSON data will be printed to the standard output. As you saw above, Micro also prints logs, which go into the standard error stream.
Depending on how you are running Micro, you might find the logs distracting. If so, you can turn off event logs with an extra option:
docker run -p 9090:9090 snowplow/snowplow-micro:4.4.0 --output-tsv \
-Dorg.slf4j.simpleLogger.log.EventLog=off
Or just discard the standard error stream entirely using the syntax appropriate for your shell:
# for bash
docker run -p 9090:9090 snowplow/snowplow-micro:4.4.0 --output-tsv \
2>/dev/null
Finally, you can save the output to a file:
docker run -p 9090:9090 snowplow/snowplow-micro:4.4.0 --output-tsv > output.tsv