Timings tracking
Create and track general timing events using the site tracking plugin.
To add performance timing context entities to your Snowplow tracking, use this Performance navigation timing plugin.
By default all its metrics are relative to the page load rather than absolute time stamps, making it easy to analyze and aggregate. To learn more about the properties tracked, you can visit the specification or MDN documentation site.
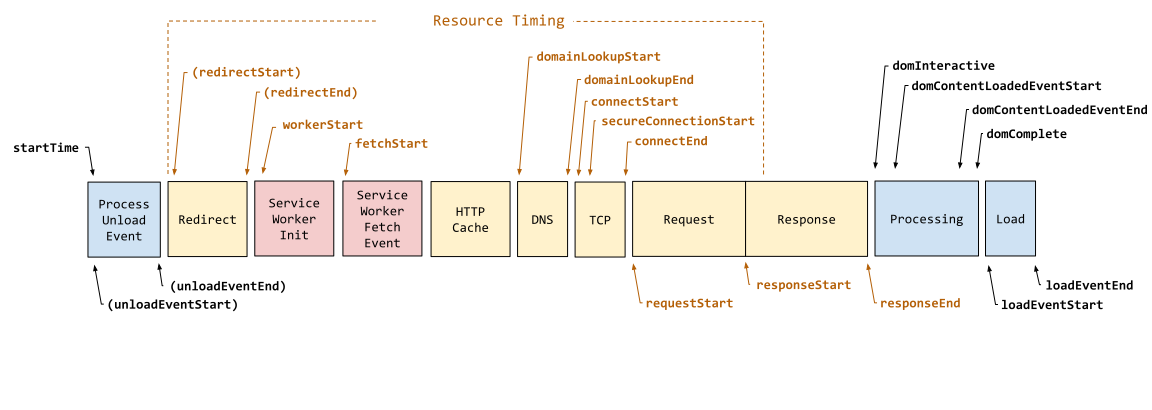
The following diagram shows the ResourceTiming and PerformanceNavigationTiming properties and how they connect to the navigation of the page main document.

Performance navigation timeline from the W3C specification.
The plugin is available since version 3.10 of the tracker.
Adding this plugin will automatically capture this context entity.
Performance navigation timing context entities are automatically tracked once configured.
Install plugin
- JavaScript (tag)
- Browser (npm)
| Tracker Distribution | Included |
|---|---|
sp.js | ❌ |
sp.lite.js | ❌ |
Download:
| Download from GitHub Releases (Recommended) | Github Releases (plugins.umd.zip) |
| Available on jsDelivr | jsDelivr (latest) |
| Available on unpkg | unpkg (latest) |
Note: The links to the CDNs above point to the current latest version. You should pin to a specific version when integrating this plugin on your website if you are using a third party CDN in production.
window.snowplow('addPlugin',
  "https://cdn.jsdelivr.net/npm/@snowplow/browser-plugin-performance-navigation-timing@3/dist/index.umd.min.js",
  ["snowplowPerformanceNavigationTiming", "PerformanceNavigationTimingPlugin"]
);
npm install @snowplow/browser-plugin-performance-navigation-timing@3yarn add @snowplow/browser-plugin-performance-navigation-timing@3pnpm add @snowplow/browser-plugin-performance-navigation-timing@3
import { newTracker, trackPageView } from '@snowplow/browser-tracker';
import { PerformanceNavigationTimingPlugin } from '@snowplow/browser-plugin-performance-navigation-timing';

newTracker('sp1', '{{collector_url}}', {
   appId: 'my-app-id',
   plugins: [ PerformanceNavigationTimingPlugin() ],
});
More detailed analysis for Single Page Applications (SPA)
As these metrics are primarily related to the initial page serve and load, after the window.onload handler ends the metrics will likely stay static for the life of the SPA page. If there's a pattern to the API requests the SPA makes for new content, the PerformanceObserver could be used to capture the network metrics for that request from the performance API and re-use the schema.
For actual rendering performance, the application will have to use the PerformanceMark/PerformanceMeasure User timing APIs. These allow custom timing milestones, but since it's completely custom and there are no common conventions for using these APIs, currently there is no automatic support in the tracker for tracking these. Therefore we encourage you to build your custom schema in case you believe you would benefit from these additional metrics.
Performance timing plugin (original)
This older plugin has been superseded by the Performance Navigation Timing plugin, which has a newer API and additional metrics such as the compressed/decompressed page size, and information about the navigation that can contextualise cache usage that can impact the measured metrics, as well as server-side metrics, etc.
If this context entity is enabled, the JavaScript Tracker will use the create a context JSON from the window.performance.timing object, along with the Chrome firstPaintTime field (renamed to chromeFirstPaint) if it exists. This data can be used to calculate page performance metrics.
Note that if you fire a page view event as soon as the page loads, the domComplete, loadEventStart, loadEventEnd, and chromeFirstPaint metrics in the Navigation Timing API may be set to zero. This is because those properties are only known once all scripts on the page have finished executing.
Advanced PerformanceTiming usage
To get around this limitation, you can wrap all Snowplow code in a setTimeout call:
setTimeout(function () {

// Load Snowplow and call tracking methods here

}, 0);
This delays its execution until after those NavigationTiming fields are set.
Additionally the redirectStart, redirectEnd, and secureConnectionStart are set to 0 if there is no redirect or a secure connection is not requested.
For more information on the Navigation Timing API, see the specification.
Performance timing context entities are automatically tracked once configured. The schema is here.
Install plugin
- JavaScript (tag)
- Browser (npm)
| Tracker Distribution | Included |
|---|---|
sp.js | ✅ |
sp.lite.js | ❌ |
Download:
| Download from GitHub Releases (Recommended) | Github Releases (plugins.umd.zip) |
| Available on jsDelivr | jsDelivr (latest) |
| Available on unpkg | unpkg (latest) |
Note: The links to the CDNs above point to the current latest version. You should pin to a specific version when integrating this plugin on your website if you are using a third party CDN in production.
window.snowplow('addPlugin',
  "https://cdn.jsdelivr.net/npm/@snowplow/browser-plugin-performance-timing@3/dist/index.umd.min.js",
  ["snowplowPerformanceTiming", "PerformanceTimingPlugin"]
);
npm install @snowplow/browser-plugin-performance-timing@3yarn add @snowplow/browser-plugin-performance-timing@3pnpm add @snowplow/browser-plugin-performance-timing@3
import { newTracker, trackPageView } from '@snowplow/browser-tracker';
import { PerformanceTimingPlugin } from '@snowplow/browser-plugin-performance-timing';

newTracker('sp1', '{{collector_url}}', {
   appId: 'my-app-id',
   plugins: [ PerformanceTimingPlugin() ],
});