Example Table and Visualization
A closer look at the output
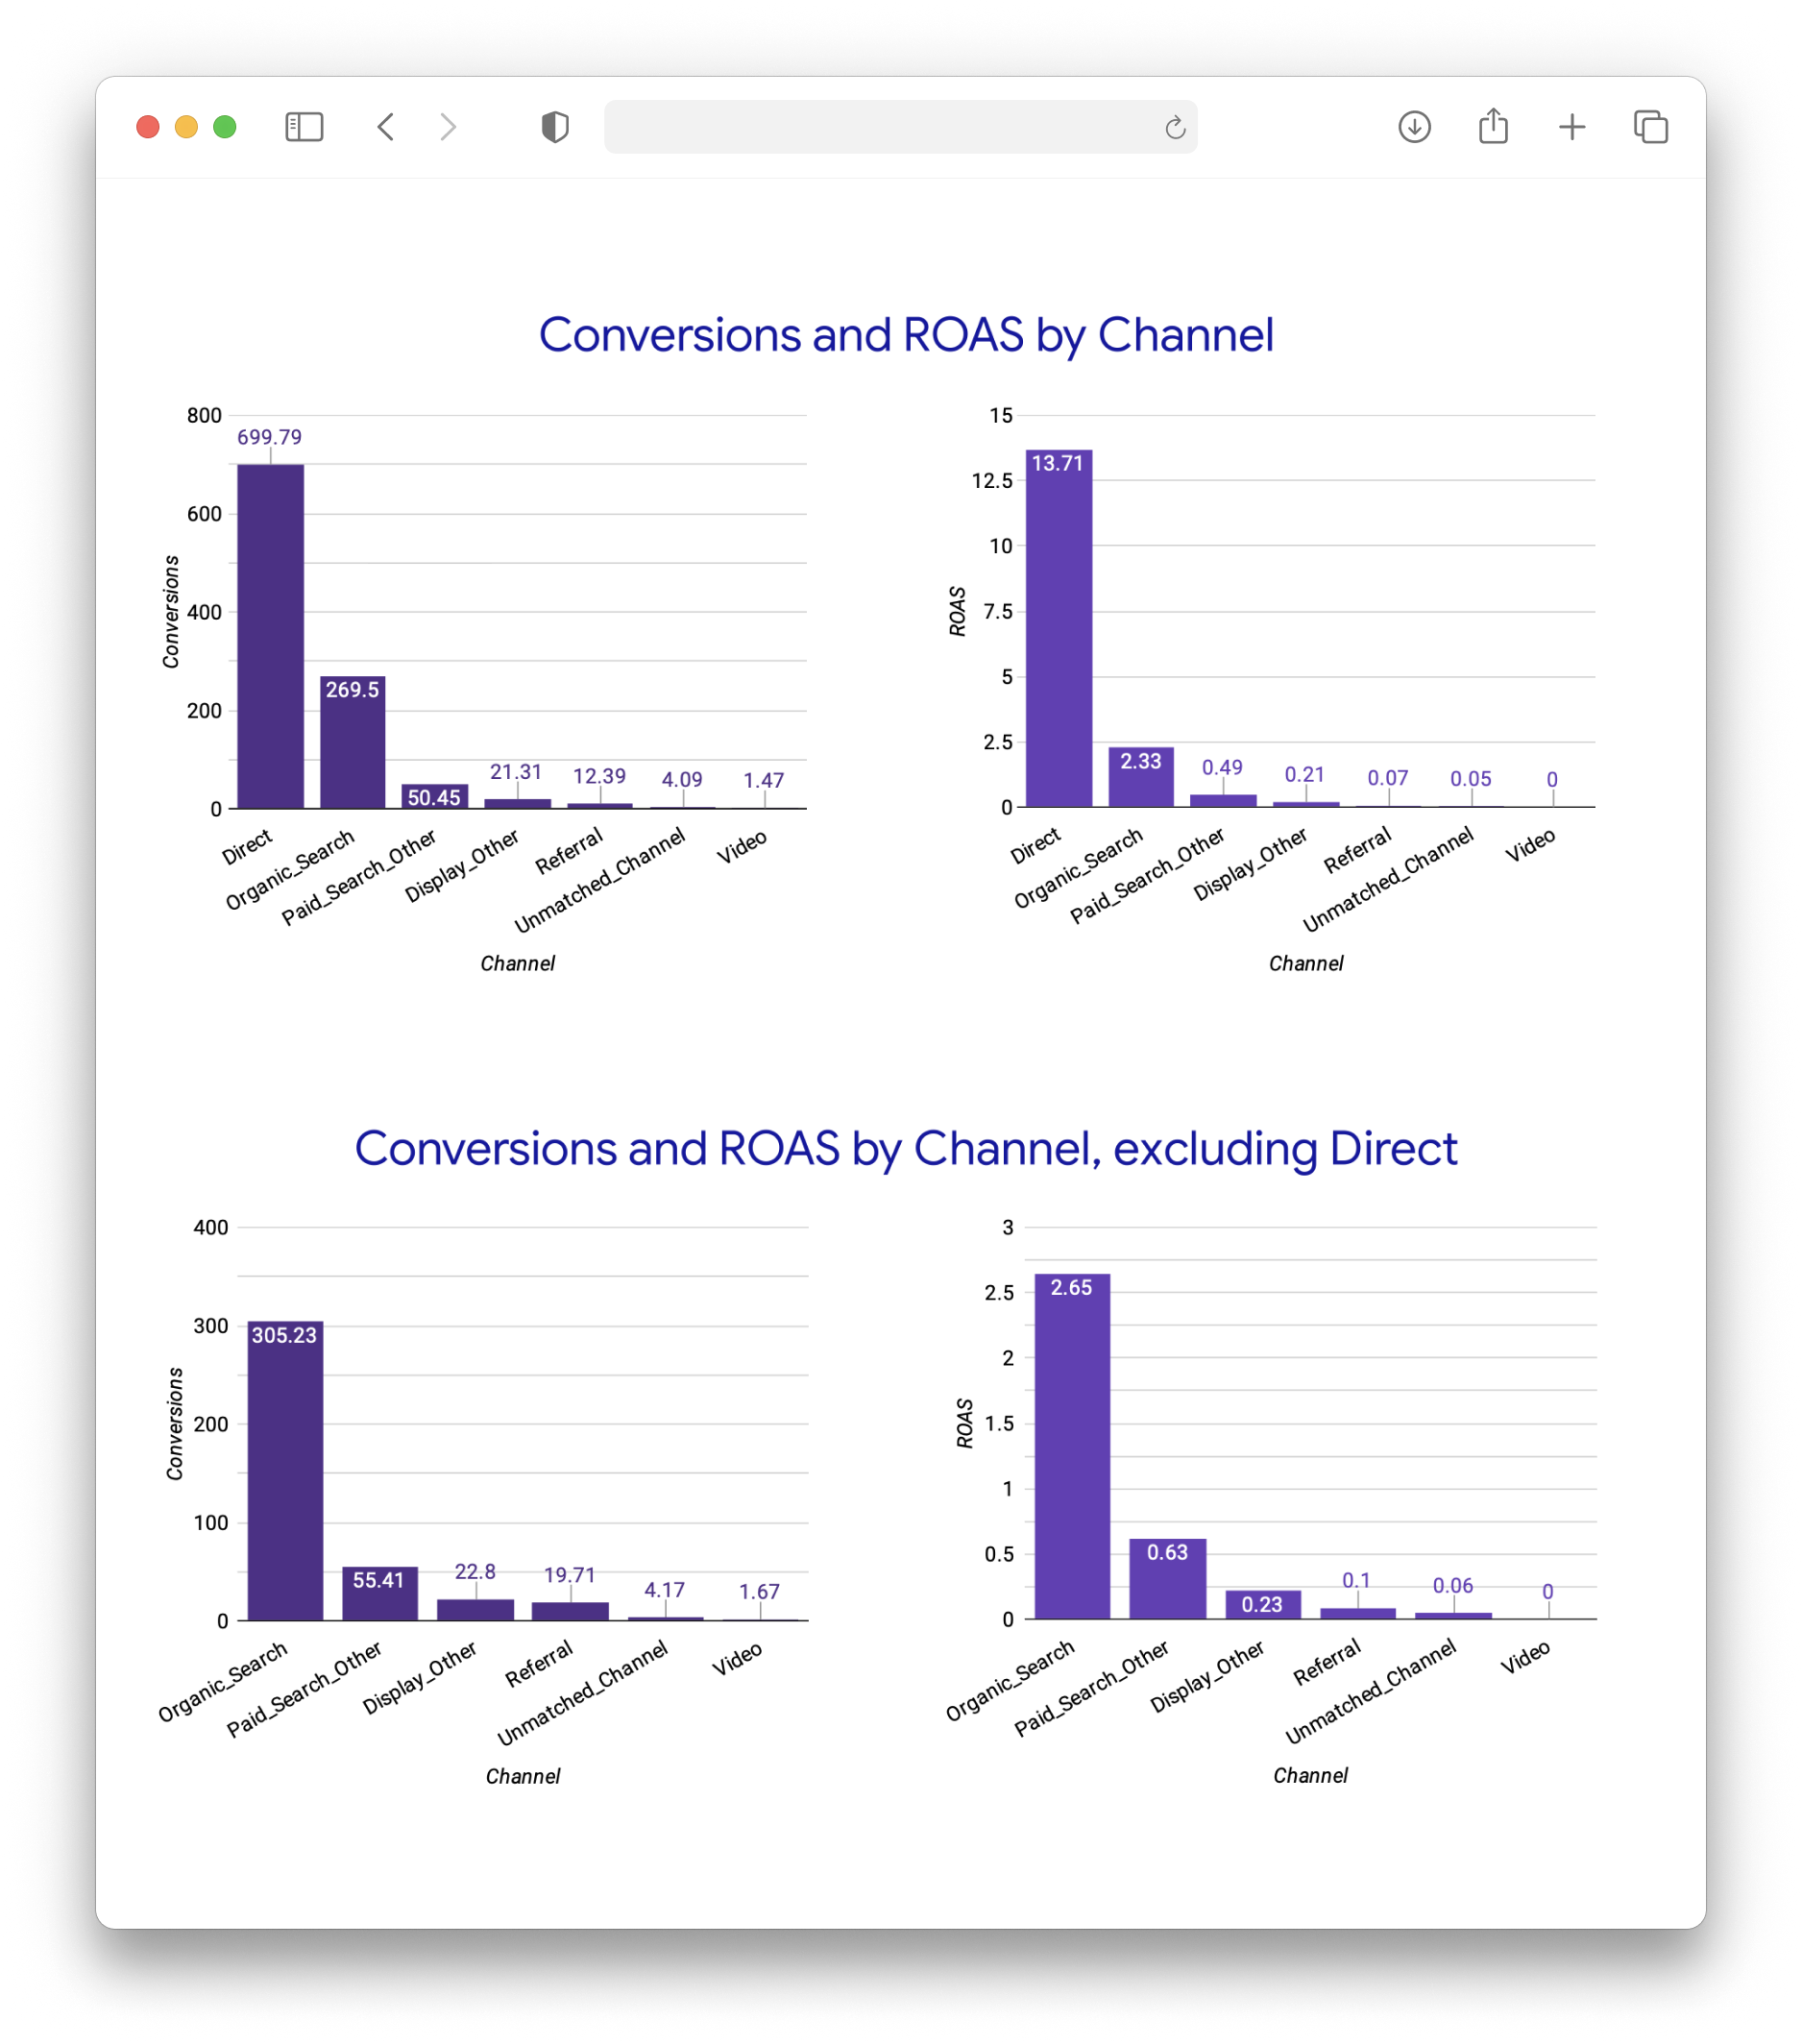
Below is an example of an attribution report table, which shows the calculated ROAS by attribution channel.
| conversion_window_start_date | conversion_window_end_date | channel | conversions | revenue | spend | roas |
|---|---|---|---|---|---|---|
| 2022-06-03 | 2022-08-01 | Direct | 699.8 | 137050.5 | 10000.0 | 13.7 |
| 2022-06-03 | 2022-08-01 | Organic_Search | 269.5 | 23292.3 | 10000.0 | 2.33 |
| 2022-06-03 | 2022-08-01 | Paid_Search_Other | 50.4 | 4875.5 | 10000.0 | 0.49 |
| 2022-06-03 | 2022-08-01 | Display_Other | 21.3 | 2069.0 | 10000.0 | 0.21 |
| 2022-06-03 | 2022-08-01 | Referral | 12.4 | 653.3 | 10000.0 | 0.07 |
| 2022-06-03 | 2022-08-01 | Unmatched_Channel | 4.08 | 544.6 | 10000.0 | 0.05 |
| 2022-06-03 | 2022-08-01 | Video | 1.5 | 29.5 | 10000.0 | 0.003 |
This table shows the ROAS figures for each channel during the conversion window specified. It also shows the conversions attributed to each channel, and the revenue associated with that channel. In our example we have a uniform spend ($10000) for each channel but you can substitute and join this to your own internal dataset to accurately account for spend and ROAS for your own marketing budgets, see Next steps.
If we had instead specified to remove the Direct channel using the snowplow__channels_to_exclude variable, the table would look as follows:
| conversion_window_start_date | conversion_window_end_date | channel | conversions | revenue | spend | roas |
|---|---|---|---|---|---|---|
| 2022-06-03 | 2022-08-01 | Organic_Search | 305.2 | 26517.5 | 10000.0 | 2.65 |
| 2022-06-03 | 2022-08-01 | Paid_Search_Other | 55.4 | 6250.6 | 10000.0 | 0.63 |
| 2022-06-03 | 2022-08-01 | Display_Other | 22.8 | 2254.1 | 10000.0 | 0.23 |
| 2022-06-03 | 2022-08-01 | Referral | 19.7 | 951.1 | 10000.0 | 0.10 |
| 2022-06-03 | 2022-08-01 | Unmatched_Channel | 4.17 | 552.0 | 10000.0 | 0.06 |
| 2022-06-03 | 2022-08-01 | Video | 1.7 | 29.1 | 10000.0 | 0.003 |
For comparison, below is an example of the output of running a traditional last-touch attribution model on the same sample data - example instructions here. The arrows beside the values indicate the direction of the difference in attribution calculated.
| conversion_window_start_date | conversion_window_end_date | channel | conversions | revenue | spend | roas |
|---|---|---|---|---|---|---|
| 2022-06-03 | 2022-08-01 | Direct | (↓) 687 | (↓) 121247.1 | 10000.0 | (↓) 12.1 |
| 2022-06-03 | 2022-08-01 | Organic_Search | (↑) 289 | (↑) 26409.3 | 10000.0 | (↑) 2.64 |
| 2022-06-03 | 2022-08-01 | Paid_Search_Other | (↓) 44 | (↓) 3743.0 | 10000.0 | (↓) 0.37 |
| 2022-06-03 | 2022-08-01 | Display_Other | (↓) 18 | (↓) 1727.1 | 10000.0 | (↓) 0.17 |
| 2022-06-03 | 2022-08-01 | Referral | (↑) 14 | (↑) 788.8 | 10000.0 | (↑) 0.08 |
| 2022-06-03 | 2022-08-01 | Unmatched_Channel | (↓) 4 | (↓) 517.7 | 10000.0 | () 0.05 |
| 2022-06-03 | 2022-08-01 | Video | (↓) 1 | (↓) 8.49 | 10000.0 | (↓) 0.001 |
The above attribution data can also be visualized in your preferred BI tool, for example: