Welcome to the Advanced Analytics for Mobile accelerator. Once finished, you will be able to build a deeper understanding of customer behavior on your mobile apps and use your data to influence business decisions.
Here you will learn to:
- Model and Visualize Snowplow data
- using the snowplow-mobile dbt package and Streamlit
- using our sample data (no need to have a working pipeline)
- Set-up Snowplow Tracking in a mobile app
- track events both from an native iOS/Android, React Native, or Flutter app
- Apply what you have learned on your own pipeline to gain insights
Who is this guide for?
- Data practitioners who would like to get familiar with Snowplow data.
- Data practitioners who would like to set up tracking in a mobile app and learn how to use the Snowplow mobile data model to gain insight from their customers’ behavioral data as quickly as possible.
What you will learn
In approximately 9 working hours you can achieve the following:
- Upload data - Upload a sample Snowplow events dataset to your warehouse
- Model - Configure and run the snowplow-mobile data model
- Visualize - Visualize the modeled data with Streamlit
- Track - Set-up and deploy tracking to your mobile app
- Next steps - Gain value from your own pipeline data through modeling and visualization
gantt
dateFormat HH-mm
axisFormat %M
section 1. Upload
1h :upload, 00-00, 1m
section 2. Model
2h :model, after upload, 2m
section 3. Visualize
2h :Visualize, after model, 3m
section 4. Track
3h :track, after Visualize, 3m
section 5. Next steps
1h :next steps, after track, 1m
Prerequisites
Modeling and Visualization
- dbt CLI installed or dbt Cloud account available
- New dbt project created and configured
- Python 3 Installed
- Snowflake, BigQuery or Databricks account and a user with access to create schemas and tables
Tracking
- Snowplow pipeline
- Mobile app to implement tracking on
Please note that Snowflake, BigQuery and Databricks will be used for illustration but the snowplow-mobile dbt package also supports , Postgres and Redshift.
What you will build
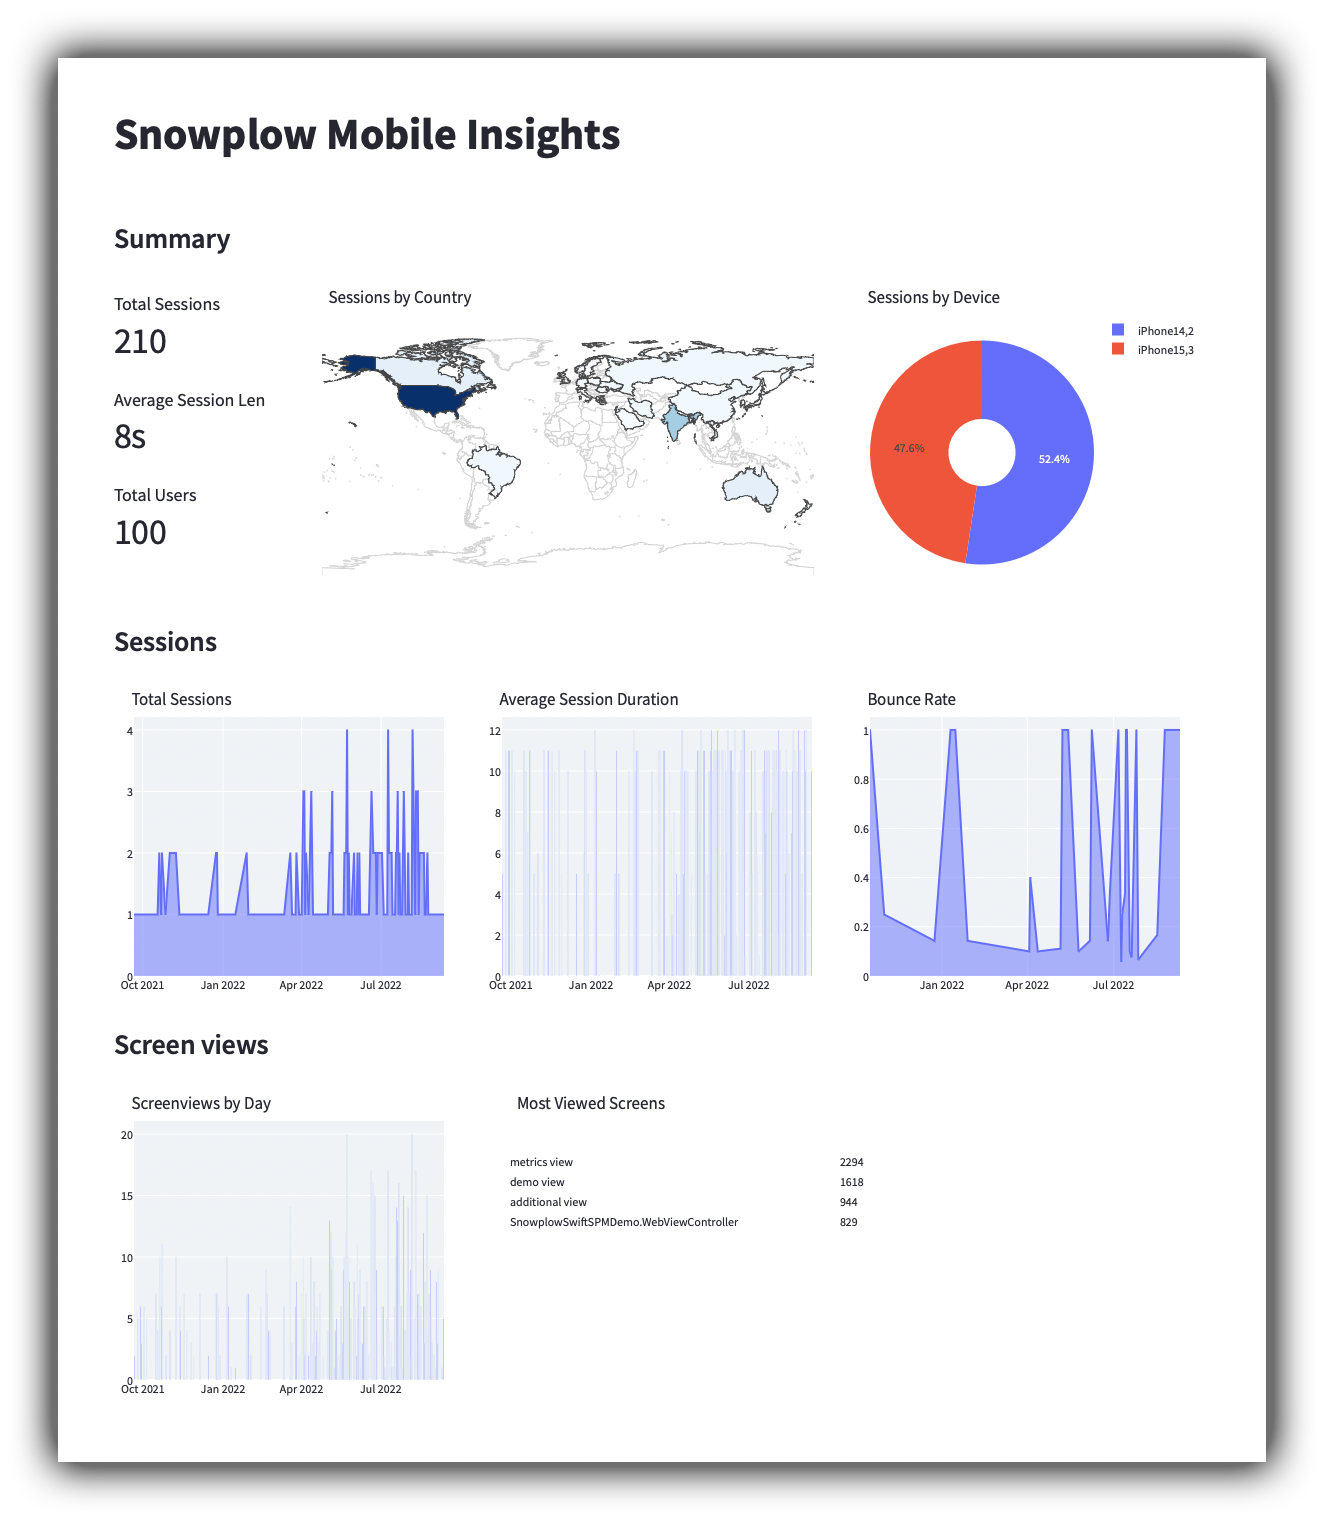
Advanced Analytics for Mobile Dashboard
System overview
The diagram below gives a complete overview of the system covered in this accelerator:
- Events are tracked from app logic inside the mobile app.
- Using the Snowplow iOS, Android, React Native, or Flutter tracker.
- Tracked events are loaded into a warehouse by the Snowplow BDP or Open Source Cloud.
- The raw events are modeled into higher level entities such as screen views, sessions, or users using the snowplow-mobile dbt package.
- Finally, we visualize the modeled data using Streamlit.
flowchart TB
subgraph mobileApp[Mobile App]
appCode[App logic]
tracker[Snowplow iOS/Android/React Native/Flutter tracker]
appCode -- "Tracks events" --> tracker
style tracker fill:#f5f5f5,stroke:#6638B8,stroke-width:3px
click tracker "https://docs.snowplow.io/docs/collecting-data/collecting-from-own-applications/mobile-trackers/installation-and-set-up/" "Open tracker docs" _blank
end
subgraph cloud[Cloud]
snowplow[Snowplow BDP/OS Cloud]
warehouse[(Warehouse)]
dbt[snowplow-mobile dbt package]
streamlit[Streamlit]
snowplow -- "Loads raw events" --> warehouse
dbt -- "Models data" --> warehouse
warehouse -- "Visualizes modeled data" --> streamlit
style dbt fill:#f5f5f5,stroke:#6638B8,stroke-width:3px
click dbt "https://docs.snowplowanalytics.com/docs/modeling-your-data/the-snowplow-mobile-data-model/dbt-mobile-data-model/" "Open dbt package" _blank
click snowplow "https://snowplow.io/snowplow-bdp/" "Snowplow BDP" _blank
end
tracker -- "Sends tracked events" --> snowplow